How can I monitor PowerMTA queue sizes by domain and set up alerts for stuck emails?

Updated on 25 Jul 2026: We updated this guide with stateful queue alerts and a practical PowerMTA triage runbook.
The direct answer is to poll PowerMTA's queue-level Web Monitor endpoint, usually /queues?format=json, read the recipient count for each destination domain and VirtualMTA queue, and alert only when the queue stays above its threshold without draining across repeated checks. Use /domains?format=json when an aggregate domain total is enough. A single high queue count does not prove that mail is stuck.
For PowerMTA v5.x, start with the Web Monitor host and management port already configured for the server. Port 8080 is common, but it is not safe to assume every installation uses it. Replace /ui/ with /queues?format=json and inspect one response before writing the parser. Field names and nesting can differ by PowerMTA build, and list endpoints can return only a configured maximum number of rows.
Once the queue has recovered, send a real test message through an email tester so you can confirm the message leaves PowerMTA cleanly and the headers still pass authentication checks.
Connect to the PowerMTA queue feed
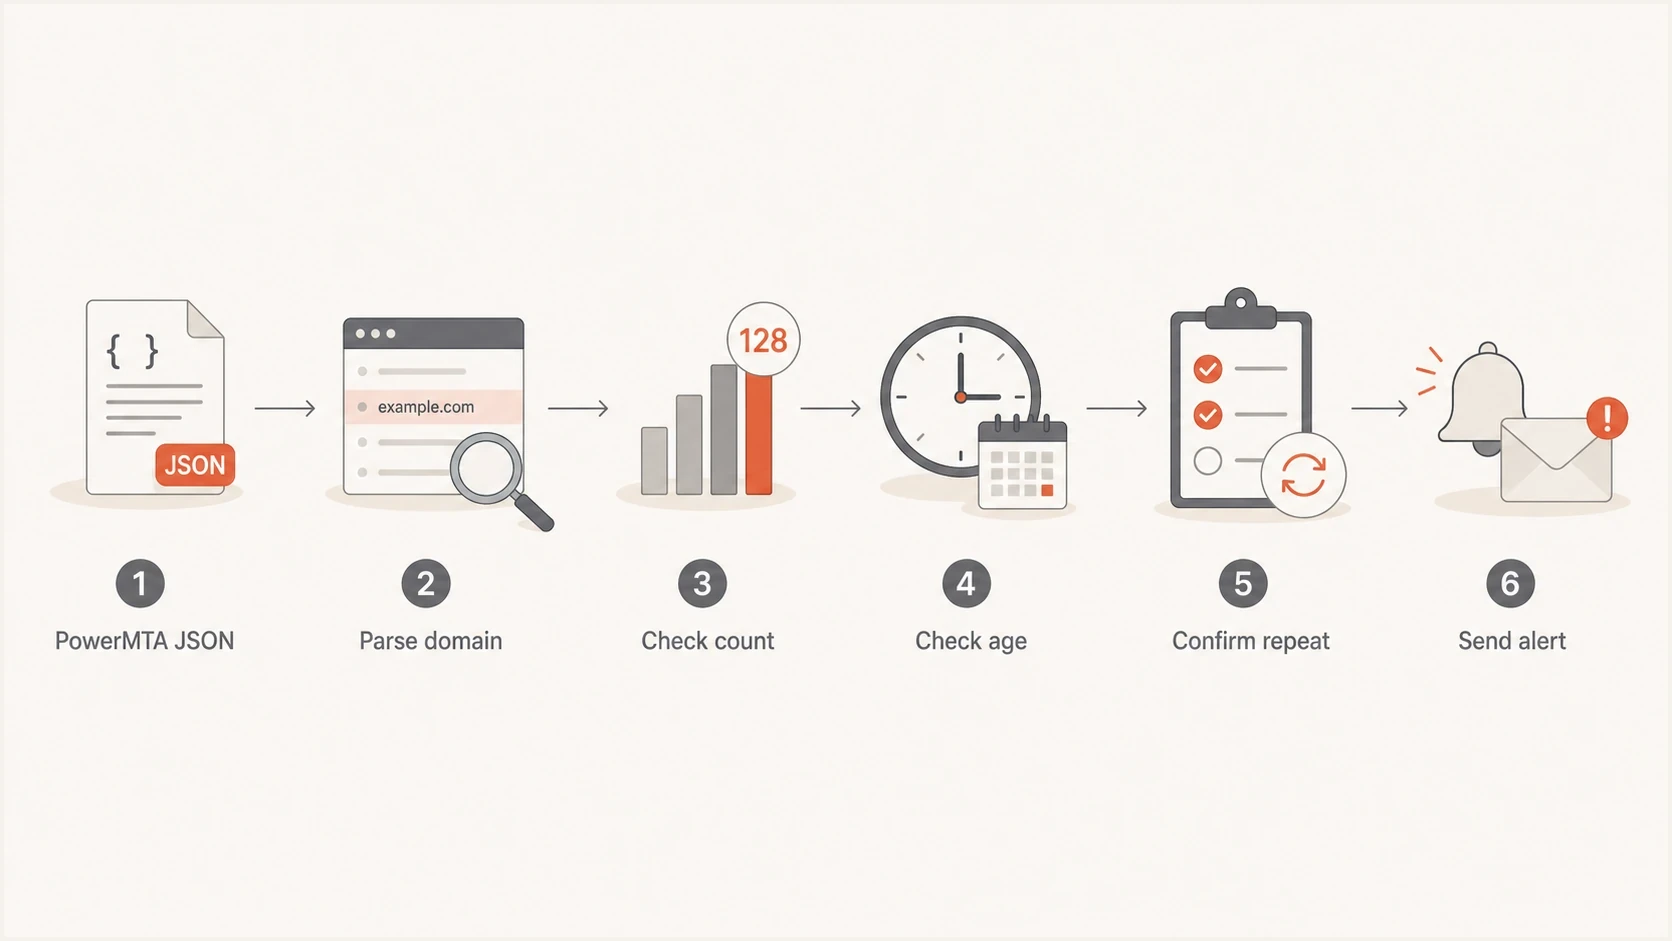
PowerMTA queue monitoring flow from JSON collection to a sustained stuck email alert.
First confirm that the PowerMTA Web Monitor is enabled and reachable only from a trusted monitoring host. PowerMTA maintains a separate queue for each destination domain and VirtualMTA combination, so the queue endpoint preserves details that a domain total can hide. There is no need to scrape the browser UI or read spool files for a first alerting setup.
Fetch the PowerMTA queue JSONbash
curl -fsS -u "monitor:REDACTED" \
  "http://127.0.0.1:8080/queues?format=json" \
  > /var/tmp/pmta-queues.json
Do not expose the Web Monitor port to the public internet. Bind it to localhost where practical, restrict it with firewall rules or a private network, and require authentication. Queue data reveals receiver backlogs, current errors, and operational timing.
- Access: allow only the monitoring hosts that need the feed.
- Credentials: store them outside the script and limit their privileges where supported.
- Output: avoid retaining queue dumps in shared or long-lived logs.
- Coverage: confirm the endpoint returns every queue you intend to monitor.
Also alert when the request fails, authentication is rejected, the response cannot be parsed, or the sample is unexpectedly empty. A broken poller must not be interpreted as zero queued mail. If access to the Web Monitor is unsuitable, pmta --json show queues provides a local command-line source for the same monitoring pattern.
What to alert on
A useful alert identifies a condition that needs action. A queue depth of 20,000 recipients can be normal during a scheduled bulk campaign if it is draining. A queue depth of 1,000 can be serious when the same messages keep aging and the receiver returns the same temporary response.
|
|
|
|---|---|---|
Queue depth | Shows the recipient backlog for the domain and VirtualMTA. | Compare it with the normal peak for that traffic stream. |
Oldest age | Separates a brief injection burst from delayed mail. | Use queue detail or persisted observations when the summary omits it. |
Drain rate | Shows whether delivery is recovering between polls. | Require sustained non-drain before alerting. |
Last error | Distinguishes throttling, DNS failures, and policy responses. | Include the response in the alert context. |
Queue state | Shows whether the queue is paused or in backoff mode. | Route configuration conditions separately from receiver delays. |
Use several queue signals before paging someone.
A starting age model
These bands are initial values for a time-sensitive stream. Tune them against normal delivery time for each traffic class and receiver.
Normal
0-20 min
The queue is draining and the oldest observed mail is fresh.
Watch
20-45 min
The queue is high or aging, but recovery is still visible.
Alert
45+ min
The queue remains above its limit and does not drain.
Use separate limits for transactional and bulk VirtualMTAs, then tune them for each receiver group. Large receiver queues often need higher count thresholds than small corporate domains because campaign volume is uneven. Typo domains and dead domains need strict handling because they rarely recover into good delivery. The related PowerMTA retry settings control how quickly mail is attempted again.
A stateful alert script
The example below persists the previous queue depth, requires three high readings with less than five percent drain, and sends only the first alert for an ongoing condition. It uses common placeholder field names because PowerMTA JSON nesting differs across builds. Inspect a real response and adjust queue_rows() and the field tuples before scheduling it.
Python queue threshold checkerpython
#!/usr/bin/env python3
import base64
import json
import os
import sys
from urllib.request import Request, urlopen

URL = os.environ["PMTA_QUEUES_URL"]
USER = os.environ.get("PMTA_USER", "")
PASSWORD = os.environ.get("PMTA_PASS", "")
STATE_FILE = os.environ.get(
    "PMTA_QUEUE_STATE", "/var/tmp/pmta-queue-watch-state.json"
)

LIMITS = {
    "gmail.com": 8000,
    "google.rollup": 12000,
    "hotmail.com": 5000,
    "outlook.com": 5000,
    "microsoft.rollup": 9000,
}

REQUIRED_READINGS = 3
MIN_REMAINING_RATIO = 0.95


def pick(row, names, default=None):
    for name in names:
        if name in row and row[name] not in ("", None):
            return row[name]
    return default


def as_int(value):
    return int(str(value).replace(",", ""))


def queue_rows(payload):
    if isinstance(payload, list):
        return payload
    if isinstance(payload, dict):
        for key in ("queues", "data", "records"):
            value = payload.get(key)
            if isinstance(value, list):
                return value
            if isinstance(value, dict):
                rows = queue_rows(value)
                if rows:
                    return rows
    return []


def fetch_json():
    request = Request(URL)
    if USER and PASSWORD:
        raw = f"{USER}:{PASSWORD}".encode()
        token = base64.b64encode(raw).decode()
        request.add_header("Authorization", f"Basic {token}")
    with urlopen(request, timeout=10) as response:
        return json.load(response)


def load_state():
    try:
        with open(STATE_FILE, encoding="utf-8") as handle:
            return json.load(handle)
    except FileNotFoundError:
        return {}


def save_state(state):
    temporary = f"{STATE_FILE}.tmp"
    with open(temporary, "w", encoding="utf-8") as handle:
        json.dump(state, handle)
    os.replace(temporary, STATE_FILE)


def main():
    payload = fetch_json()
    rows = queue_rows(payload)
    if not rows:
        raise RuntimeError("PowerMTA returned no queue rows; verify JSON mapping")

    previous = load_state()
    current = {}
    new_alerts = []

    for row in rows:
        queue = str(pick(row, ("name", "queue", "queueName"), "")).lower()
        queued_value = pick(row, ("rcpt", "recipients", "queued"))
        if not queue or queued_value is None:
            continue

        domain = queue.split("/", 1)[0]
        limit = LIMITS.get(domain)
        if limit is None:
            continue

        queued = as_int(queued_value)
        old = previous.get(queue, {})
        old_queued = as_int(old.get("queued", 0))
        high = queued >= limit
        not_draining = old_queued > 0 and queued >= old_queued * MIN_REMAINING_RATIO

        if high:
            streak = int(old.get("streak", 0)) + 1 if not_draining else 1
        else:
            streak = 0

        active = streak >= REQUIRED_READINGS
        already_alerted = bool(old.get("alerted", False))
        current[queue] = {
            "queued": queued,
            "streak": streak,
            "alerted": active,
        }

        if active and not already_alerted:
            new_alerts.append(
                f"{queue}: {queued} queued, high and not draining "
                f"for {streak} readings"
            )

    save_state(current)

    if new_alerts:
        print("\n".join(new_alerts))
        return 2

    print("ok")
    return 0


try:
    raise SystemExit(main())
except Exception as error:
    print(f"PowerMTA queue monitor failed: {error}", file=sys.stderr)
    raise SystemExit(1)
Run the script manually and compare every parsed queue name and recipient count with the PowerMTA Web Monitor before enabling alerts. A successful HTTP response does not prove that the parser found the right fields. If the endpoint limits the number of rows, raise that limit through the supported view options or use the local JSON command so a smaller queue is not omitted.
Simple alert wrapperbash
#!/bin/sh
export PMTA_QUEUES_URL="http://127.0.0.1:8080/queues?format=json"
export PMTA_USER="monitor"
export PMTA_PASS="REDACTED"

umask 077
/usr/local/bin/pmta_queue_watch.py > /var/tmp/pmta-queue.out 2>&1
status=$?

if [ "$status" -ne 0 ]; then
  mail -s "PowerMTA queue monitor alert" ops@example.com \
    < /var/tmp/pmta-queue.out
fi

exit "$status"
Send the alert through a path that does not depend on the affected PowerMTA queue. The wrapper only illustrates how to pass the exit status and output to a notifier. If PowerMTA cannot drain the receiver queue, an alert sent through the same route can wait behind the incident.
Triage a stuck queue before changing limits
A sustained alert tells you where delivery has slowed, but it does not identify the cause by itself. Inspect the exact domain and VirtualMTA queue before raising connection or message-rate limits. Queue errors, mode changes, paused state, and disabled sources often explain the backlog without any threshold change.
Read-only queue triage commandsbash
pmta show queues --errors --mode-events gmail.com/*
pmta show disabled sources gmail.com/*
pmta show settings gmail.com/*
pmta show status
|
|
|
|---|---|---|
Paused queue | An operator or automation stopped delivery. | Confirm the reason and owner before resuming it. |
Backoff mode | A response pattern or command reduced delivery pressure. | Review mode events and the matching SMTP pattern. |
Repeated 4xx response | The receiver is temporarily deferring mail. | Classify the response before changing retry or rate controls. |
DNS or connection error | PowerMTA cannot reach the destination MX reliably. | Check resolution, routing, firewall state, and source availability. |
Injection exceeds delivery | The queue can grow even while delivery is healthy. | Compare submitted and delivered rates before paging. |
Use the queue state and remote response to choose the next action.
Do not force repeated immediate retries against a receiver that is already deferring mail. Preserve the last error and recent mode events in the incident record, then change delivery controls only when the response and normal throughput support that action.
Group receiver domains with rollups
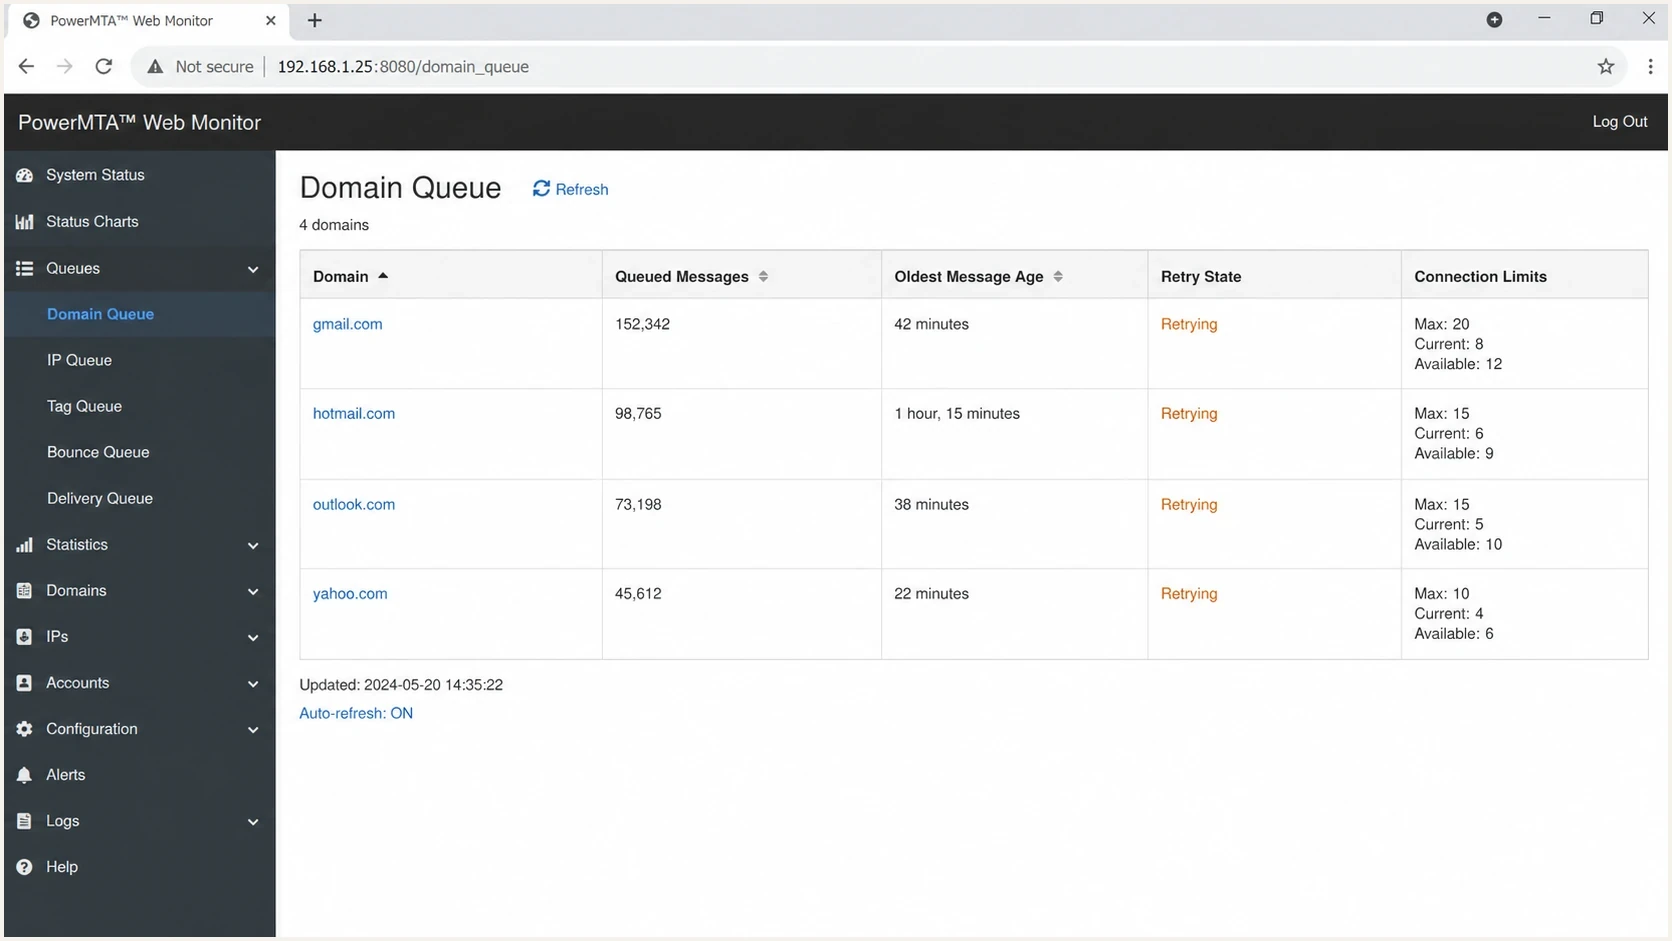
PowerMTA Web Monitor queue sizes by domain with retry state and connection data.
Per-domain alerts are useful, but receiver infrastructure does not always map neatly to one visible domain. Hosted mail and large consumer mailbox providers can appear across several MX patterns. PowerMTA rollups group related MX destinations so the queue signal matches the receiver system being managed.
Example PowerMTA MX rollupstext
<mx-rollup-list>
  mx *.l.google.com google.rollup rollup-by-ip
  mx *.google.com google.rollup rollup-by-ip
  mx *.googlemail.com google.rollup rollup-by-ip
  mx *.mail.protection.outlook.com microsoft.rollup rollup-by-ip
</mx-rollup-list>
Match only the lowest-preference, highest-priority MX records returned by DNS, and validate each wildcard against current DNS results before deployment. Define explicit delivery controls for each rollup queue. A broad or stale wildcard can combine traffic that should have separate limits.
After adding rollups, alert on the rollup when it gives a clearer operational signal. A campaign can spread queue pressure across related MX hosts, and one rollup alert prevents several small warnings for the same receiver condition.
- Hosted mail: use rollups only when related MX destinations need shared controls.
- Priority domains: retain individual alerts when one customer domain needs separate handling.
- Typo domains: apply strict limits or suppress known bad recipient data after cleanup.
- Validation: confirm queue names and routing after every rollup change.
Queue alerts are not delay notices
PowerMTA also has delay notification behavior, but it is not queue-size monitoring. A delay notice is message-level reporting tied to delivery status notification behavior. A queue alert is an operator alert that says a destination queue needs attention.
Queue alert
- Audience: operations or deliverability staff.
- Trigger: queue depth, age, state, and sustained non-drain.
- Response: inspect errors and traffic before changing controls.
Delay notice
- Audience: the envelope sender or calling application.
- Trigger: delivery status notification timing.
- Response: handle the delayed message in the sending application.
Delay notification timing exampletext
<domain hotmail.com>
  notify-of-delay-every 1h
</domain>
That directive controls how often PowerMTA checks for delay notices when the SMTP recipient requested NOTIFY=DELAY. It does not replace a queue threshold alert. Keep the controls separate so operators receive queue alerts and applications receive the delivery status behavior they expect.
Connect queue alerts to domain health
PowerMTA shows where mail is backing up and records the receiver response. It does not establish by itself whether the wider cause includes authentication failure, a DNS mistake, a blacklist or blocklist listing, sender reputation, or local capacity. Those signals need to be checked alongside the queue.
Issues page showing top issues, verified sources, unverified sources, and authentication pass rates
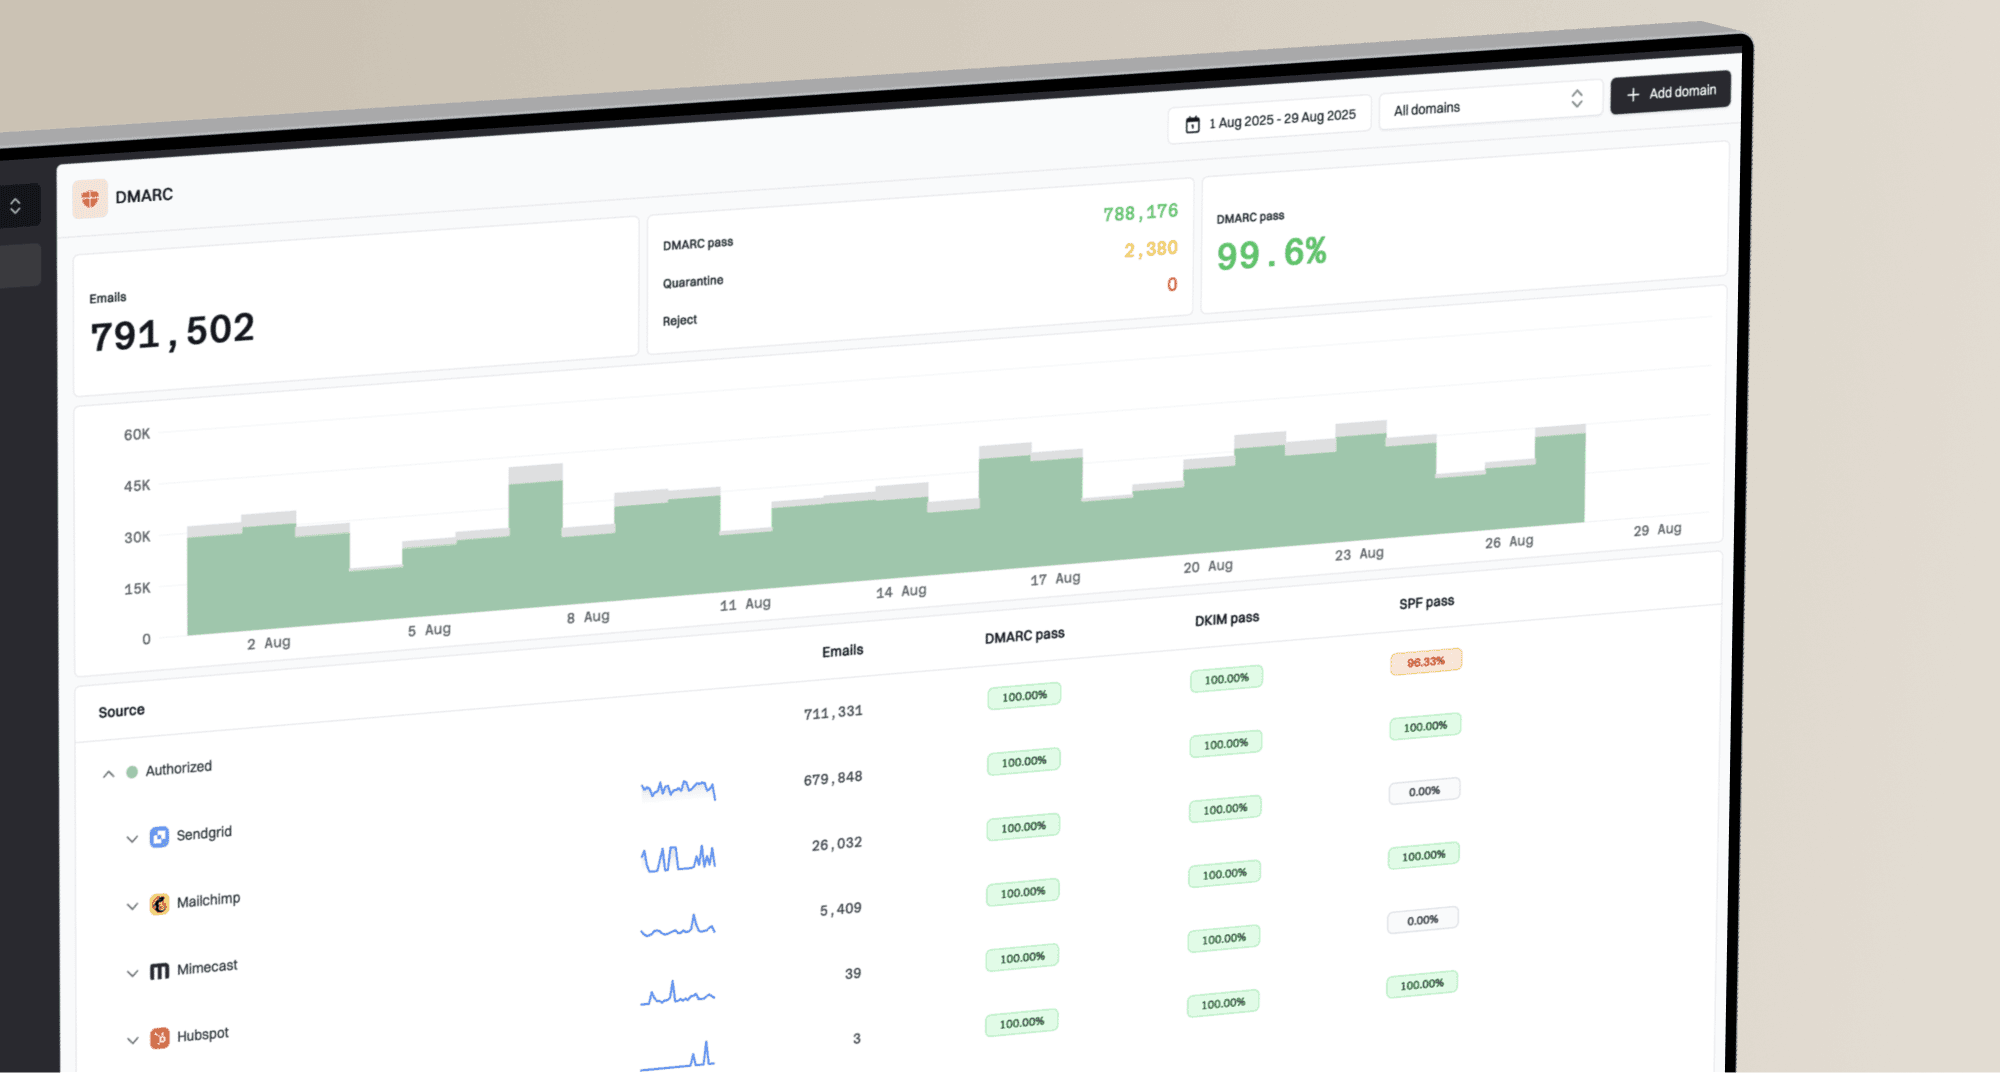
The practical split is that PowerMTA detects and explains the MTA-side queue condition, while Suped's product supplies the surrounding domain authentication and reputation context. Suped's DMARC monitoring shows whether each identified sending source passes SPF, DKIM, and DMARC. Suped's blocklist monitoring checks for IP or domain listings that can coincide with throttling and queue growth.
Suped groups authentication and reputation signals into issues with remediation steps. During a queue incident, this can show whether the affected source also has DMARC failures, an unauthorized sender, or a blocklist or blacklist listing. Treat that as supporting evidence because queue growth can also come from receiver throttling, DNS failure, or local capacity.
Use PowerMTA to confirm that the queue is still growing, read the last error, and identify the affected VirtualMTA. Then check Suped for authentication failures, unauthorized sources, and blocklist or blacklist status. A broad domain health check can provide supporting context before any delivery-rate change.
- Confirm: verify sustained queue growth and capture the PowerMTA error.
- Correlate: check the affected source and authentication status in Suped.
- Check reputation: review current blocklist and blacklist status.
- Act: change traffic only when the evidence supports the response.
Views from the trenches
Best practices
Poll queue-level JSON often, but alert only after sustained high, non-draining readings.
Use MX rollups for related destinations when one receiver issue needs one useful alert.
Monitor the poller itself so failed authentication never appears as a healthy empty queue.
Common pitfalls
Alerting on queue depth alone creates noise during normal campaign injection bursts.
Reading only top queues can omit smaller stuck queues when the result limit is too low.
Changing delivery rates before reading the last error can increase receiver deferrals.
Expert tips
Keep state between polls so drain rate and repeated conditions survive each script run.
Tune thresholds by VirtualMTA and receiver because normal backlog differs by traffic.
Compare queue errors with authentication and blacklist data before changing limits.
An Email Geeks contributor identifies the PowerMTA Web Monitor JSON output as a clean source for external queue monitoring and parsing.
2022-01-05 - Email Geeks
An Email Geeks contributor recommends enabling the PowerMTA Web Monitor and confirming its active port before building domain queue alerts.
2022-01-05 - Email Geeks
Recommended monitoring design
A reliable setup polls PowerMTA queue JSON every few minutes, retains state between runs, groups related receivers only where rollups are appropriate, and alerts after queue depth remains high without meaningful drain. Separate thresholds by traffic class and include the queue name, last error, and observation count in the incident context.
Do not stop at the queue alert. Check the queue state and remote response first, then review authentication, sender authorization, blocklist or blacklist status, and recent sending changes. Suped supports that second step with DMARC, SPF, DKIM, sending-source, and reputation context while PowerMTA remains the source of the MTA-side queue signal.