What is a good spam rate and what does the percentage mean?

Updated on 7 Oct 2026: We clarified complaint-rate thresholds and Gmail's recovery requirements.
A good email spam complaint rate is below 0.1%, which means fewer than 1 spam report per 1,000 counted messages. In Gmail reporting, those counted messages are mail delivered to engaged recipients' inboxes. The danger line is 0.3%, which means 3 reports per 1,000 counted messages. If a dashboard shows 1%, that is not 1 in 1,000. It is 1 in 100. If it shows 3%, that is 3 in 100.
Missing the decimal point leads to the wrong diagnosis. Treat below 0.1% as the operating target, 0.3% as an urgent warning, and anything around 1% as a serious reputation problem. A spike can still be real when authentication passes 100%, because email authentication verifies a sending identity. It does not prove that recipients wanted the message.
The percentage also depends on the denominator. Gmail's user-reported spam rate focuses on messages that reached engaged recipients' inboxes and were then marked as spam. Total sent volume is not its denominator. A low complaint rate still does not prove inbox delivery if much of the mail is already filtering to spam.
What is a good email spam complaint rate?
For Gmail and as a practical operating target, stay below 0.1%. Between 0.1% and 0.3% needs action. At 0.3% or higher, reduce send volume to weak segments and investigate. Yahoo requires a rate below 0.3%, calculated using mail delivered to the inbox. Treat 0.3% as a ceiling, not a target. At 1%, the math says 1 spam report per 100 counted messages. At 3%, investigate a serious permission or expectation problem. See Gmail's sender FAQ and Yahoo's sender requirements.
Spam rate thresholds
Practical operating bands for user-reported spam complaint rates, not guarantees of inbox placement.
Healthy
Below 0.1%
Recommended complaint-rate target.
Warning
0.1% to below 0.3%
Investigate recipient expectations and list quality.
Critical
0.3% and above
Pause risky sends and find the complaint source.
Separate spam rate from broader deliverability. A low complaint rate does not guarantee inbox placement. A domain can have clean complaint data and still land in spam because reputation, engagement, authentication, sending patterns, or a blocklist (blacklist) issue has pulled the domain down.
What the percentage means
The percentage is plain division. Spam reports are the numerator. Counted messages are the denominator. Multiply the result by 100 and you have the spam complaint rate. Many campaign reports divide complaints by delivered messages. Gmail and Yahoo use inbox-delivered subsets in their own reporting, so their percentages will not always match a campaign report. Compare the same mailbox provider and reporting period before comparing rates.
Spam complaint rate mathtext
spam rate % = spam reports / counted messages * 100

1 / 100 = 1%
1 / 1,000 = 0.1%
3 / 1,000 = 0.3%
3 / 100 = 3%
Do not confuse 1% with 0.1%
The common mistake is saying 1% equals 1 in 1,000. It does not. One complaint in 1,000 messages is 0.1%. One complaint in 100 messages is 1%. That difference changes how urgently you should respond.
|
|
|
|
|---|---|---|---|
0.05% | 1 in 2,000 | Below target | Keep watching |
0.1% | 1 in 1,000 | Warning threshold | Review targeting |
0.3% | 3 in 1,000 | Critical | Pause risky sends |
1% | 1 in 100 | Severe | Stop broad sends |
3% | 3 in 100 | Very severe | Rebuild permission |
Translate percentages into complaint counts within the reporting system's counted messages.
Spam complaint rate vs. other spam metrics
Check what the dashboard is measuring before applying a benchmark. A spam complaint rate measures recipient reports. A spam score grades a message against a filter or test, while spam-folder placement measures where messages were delivered. A 3% spam-folder placement rate does not mean that 3% of recipients clicked "Report spam".
|
|
|
|---|---|---|
Spam complaint rate | Spam reports divided by counted messages, expressed as a percentage. | Lower is better; use below 0.1% as the operating target. |
Spam score | Filter points or a test-specific grade for a message. | Read the test's scale; the 0.1% complaint target does not apply. |
Spam-folder placement rate | The percentage of delivered messages placed in spam. | Assess placement separately; a low complaint rate does not establish inbox delivery. |
Complaint percentages and message-test scores measure different outcomes.
Why spam complaint rates spike
A sudden high spam rate does not always describe the same percentage of the full mailing list. The counted denominator can be small, and recipients can report a message after the original send. One complaint among 100 counted messages is 1%, even if 10,000 messages were sent overall.
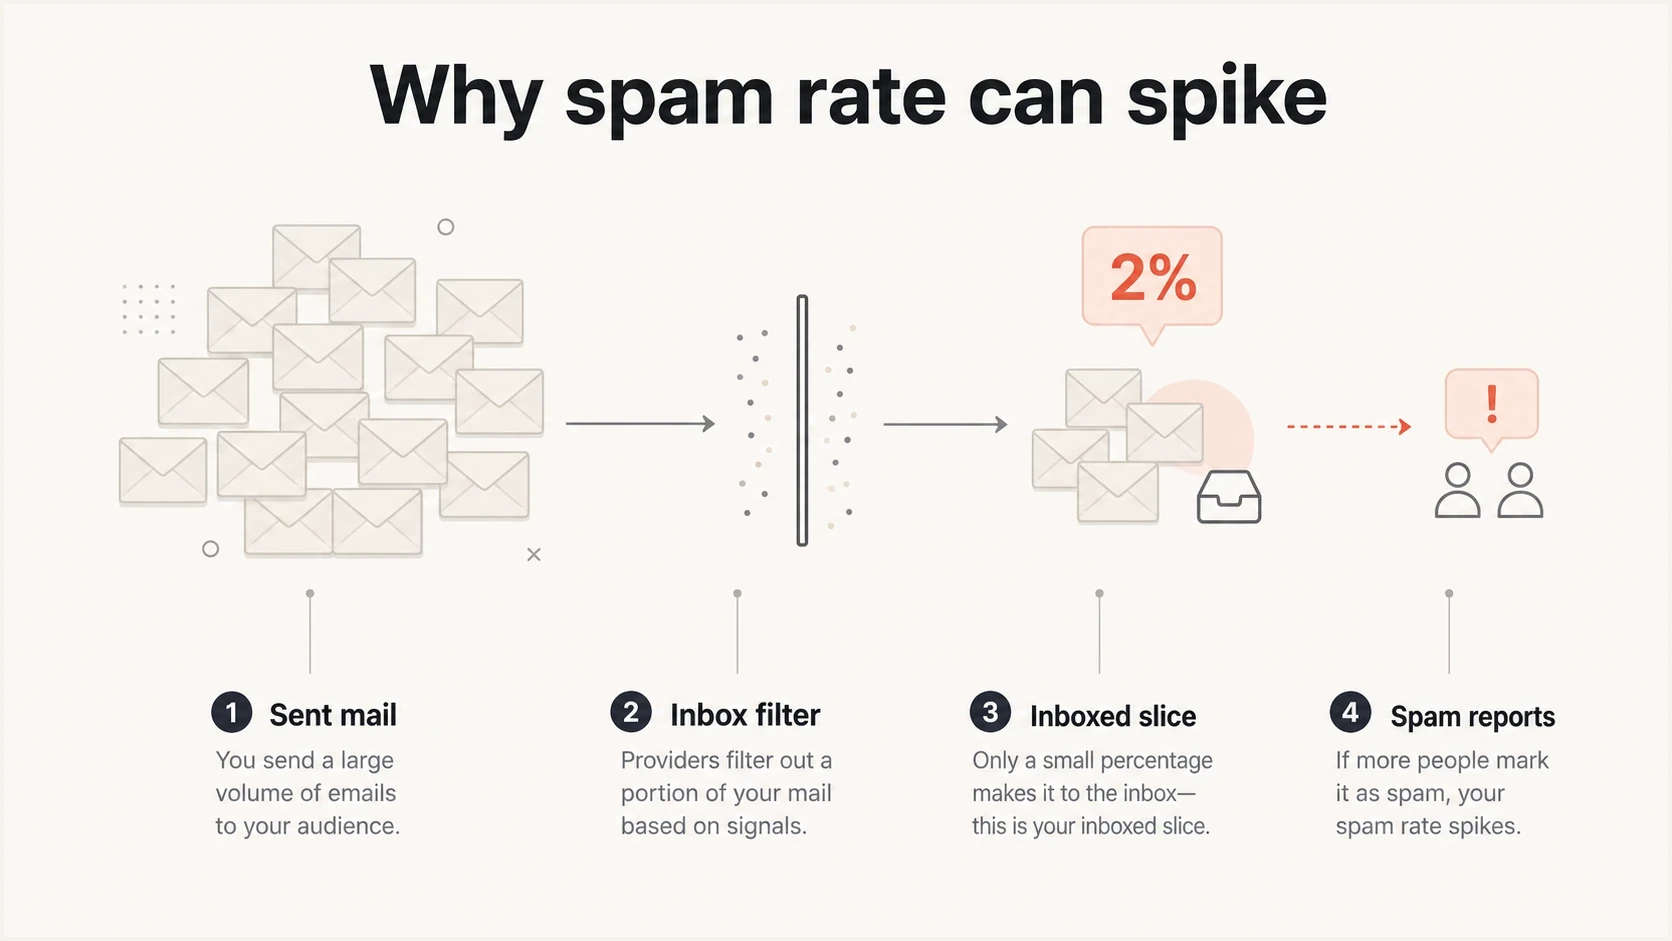
How a smaller inbox-delivered message count changes the spam complaint rate.
Gmail's spam-rate metric covers DKIM-authenticated messages sent to personal Gmail accounts and counts messages delivered to engaged recipients' inboxes. That is why active users and the counted audience matter. A campaign that sent 16,000 emails can have a denominator much smaller than 16,000. Gmail calculates the rate daily using UTC; reporting typically updates within 24 hours but can take longer. See Gmail's reporting documentation.
Same complaints, different denominator
Thirty complaints can read very differently depending on which messages are counted.
30 complaints / 10,000 counted
0.3%30 complaints / 1,000 counted
3%Missing data is not the same as 0% complaints. Low-volume days can lack reporting data for privacy reasons. A drop to zero or missing data after high complaints also warrants checking whether more mail is now being filtered to spam.
What to investigate
- Recipients who saw the message in the inbox reported it as unwanted.
- Check the counted message volume before judging the size of a percentage spike.
- Compare audiences and sending sources to locate complaint concentrations.
What the spike does not prove
- It does not always describe every recipient who was sent the campaign.
- DMARC can pass while recipients still complain about permission or timing.
- Complaints can be reported after the send date that caused them.
How to investigate a high spam rate
Start with mailbox-provider complaint data and campaign send logs, then use DMARC aggregate reports to check sending sources and authentication. DMARC report volume is limited to receivers that report; it is not the complaint-rate denominator. These reports do not contain recipient spam-button complaints or campaign IDs, and do not establish inbox placement. See the DMARC aggregate reporting specification.
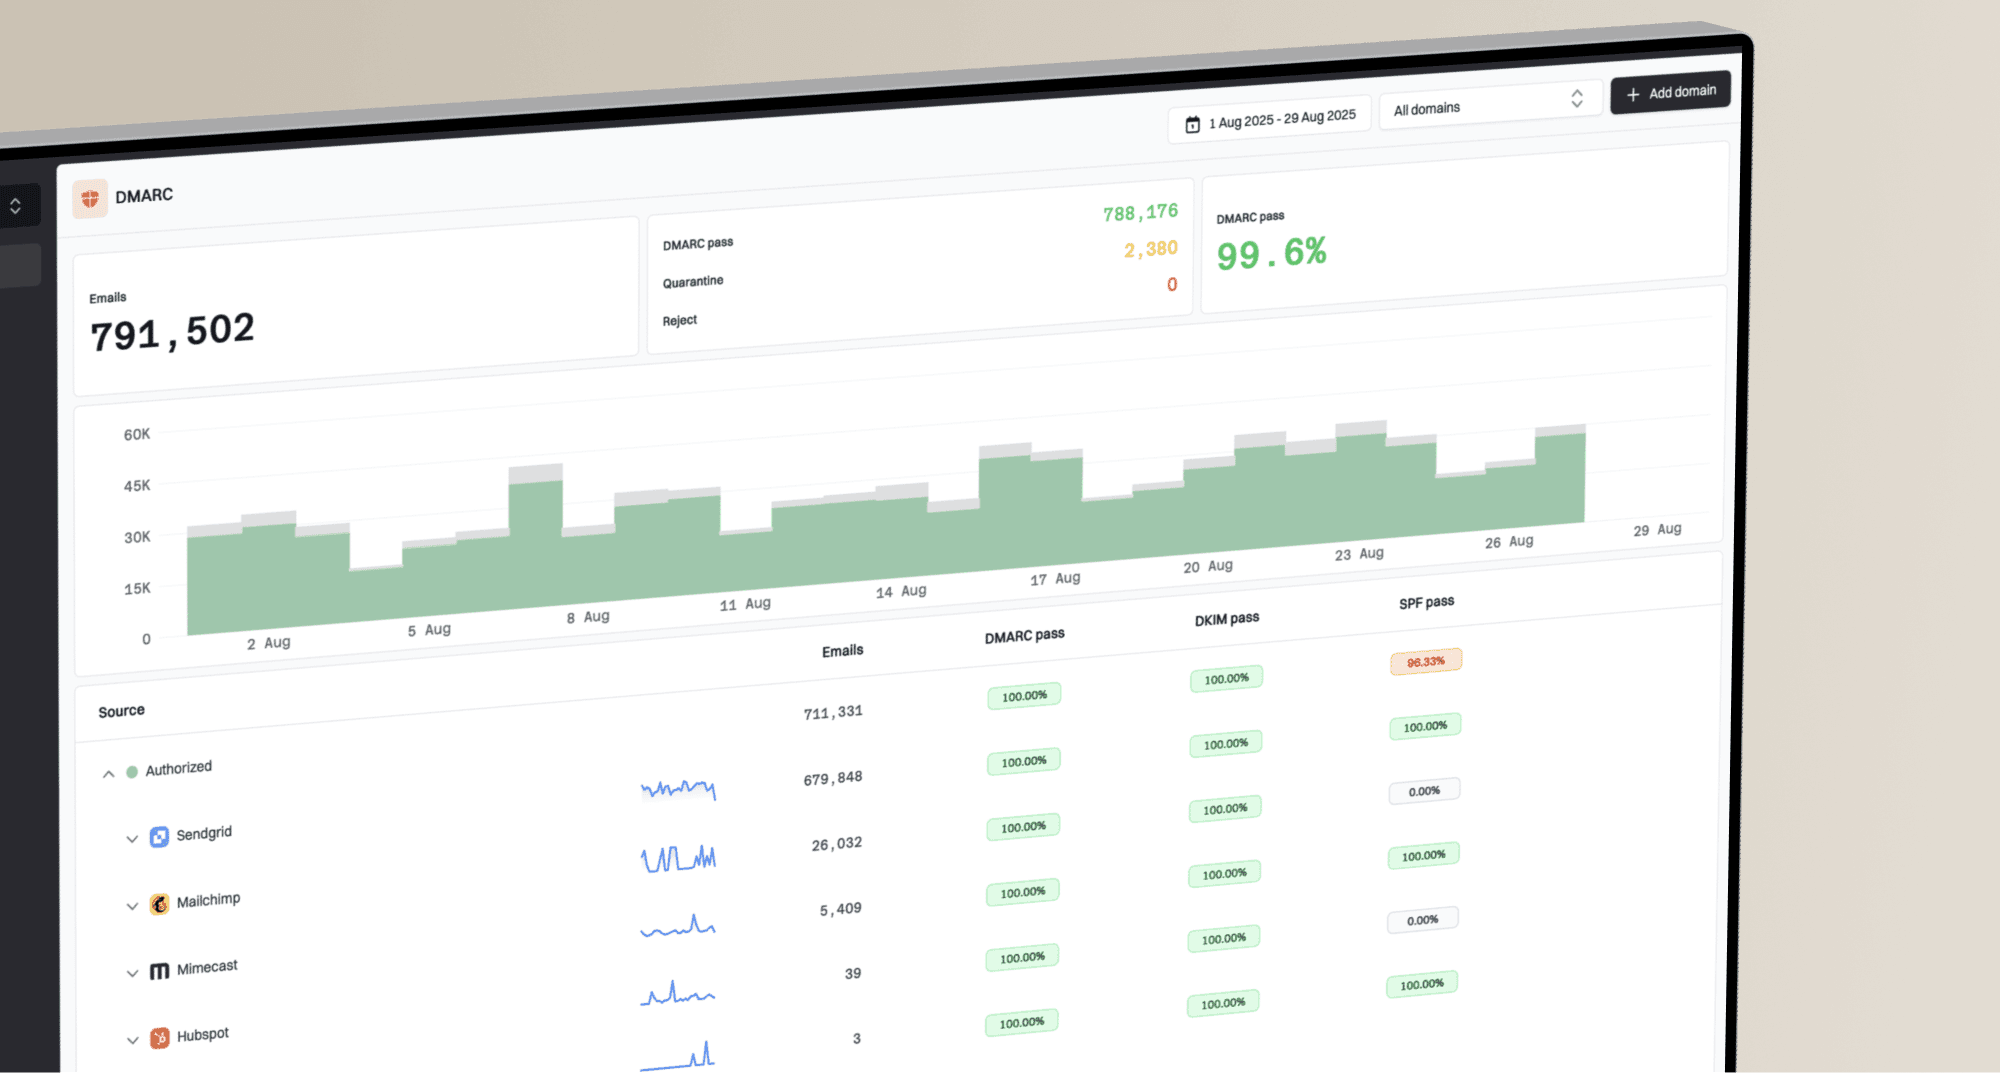
Suped DMARC dashboard showing email volume, authentication health, and source breakdown
Suped's DMARC reporting and email authentication platform helps with this investigation by showing authentication health, reported email volume, and sending-source breakdowns. Compare that data with complaint reports and campaign logs to check whether an unexpected source or authentication failure coincides with the spike.
For campaign-level diagnosis, Gmail provides aggregate complaint feedback for messages tagged with a Feedback-ID header. Yahoo sends complaint reports for enrolled DKIM signing domains, allowing identified recipients to be suppressed. Confirm that complaint feedback is enabled and processed by your sending system. See Gmail's feedback documentation and Yahoo's complaint-reporting documentation.
- Match the reporting date with actual send logs and campaign schedules. Compare Gmail's UTC reporting day with the timezone used in your campaign reports.
- Separate marketing, product, sales, support, and transactional streams before changing everything. Use campaign logs to distinguish sends that share a source.
- Treat low opens as supporting context, not proof of spam-folder placement. Filtering and measurement changes can both reduce reported opens.
- Review the subject, promise, sender name, unsubscribe clarity, and reason the recipient received the message.
- Pause weak segments and send only to recent engagers until the rate stabilizes.
For a single-message check, send a real sample to Suped's email tester and inspect authentication, headers, and unsubscribe support. For domain-wide DNS checks, use Suped's domain health checker. These checks help diagnose setup problems; they do not measure campaign complaint rates or prove inbox placement.
Authentication still matters
A spam-rate spike can happen with perfect authentication, but that does not make authentication optional. SPF and DKIM authenticate sending identities. DMARC checks whether a passing SPF or DKIM identity matches the visible From domain under its domain-matching rules and publishes a handling policy for failures. None of these checks proves recipient consent.
Suped's product connects DMARC monitoring, sending-source inventory, issue detection, and alerts with blocklist monitoring (blacklist monitoring). This helps teams compare complaint changes with authentication failures, unexpected senders, and domain-level reputation signals without treating authentication as proof of consent.
What authentication can and cannot fix
- Correct SPF and DKIM configuration, then set a DMARC policy after verifying legitimate senders.
- Use authentication reports to identify sending sources and messages that fail DMARC.
- Bad permission, stale lists, misleading content, or unwanted frequency require changes to sending practices.
Use authentication data to avoid false assumptions. If reports reveal unauthorized use of your domain, investigate the source and review DMARC enforcement after verifying legitimate mail. If the complaint spike follows an authenticated campaign, review consent, targeting, and sending frequency instead of assuming DNS changes will remove complaints.
How to bring the rate down
The fastest way to reduce spam rate is to stop sending to people most likely to complain. That usually means suppressing cold, old, unengaged, purchased, appended, scraped, or unclear-permission records. Then rebuild volume around recipients who recently clicked, purchased, logged in, replied, or otherwise showed current interest. Treat opens as supporting evidence, because open tracking is incomplete. For new subscribers, use confirmed or double opt-in where sign-up abuse is a risk, send the welcome message immediately, and state what will be sent and how often.
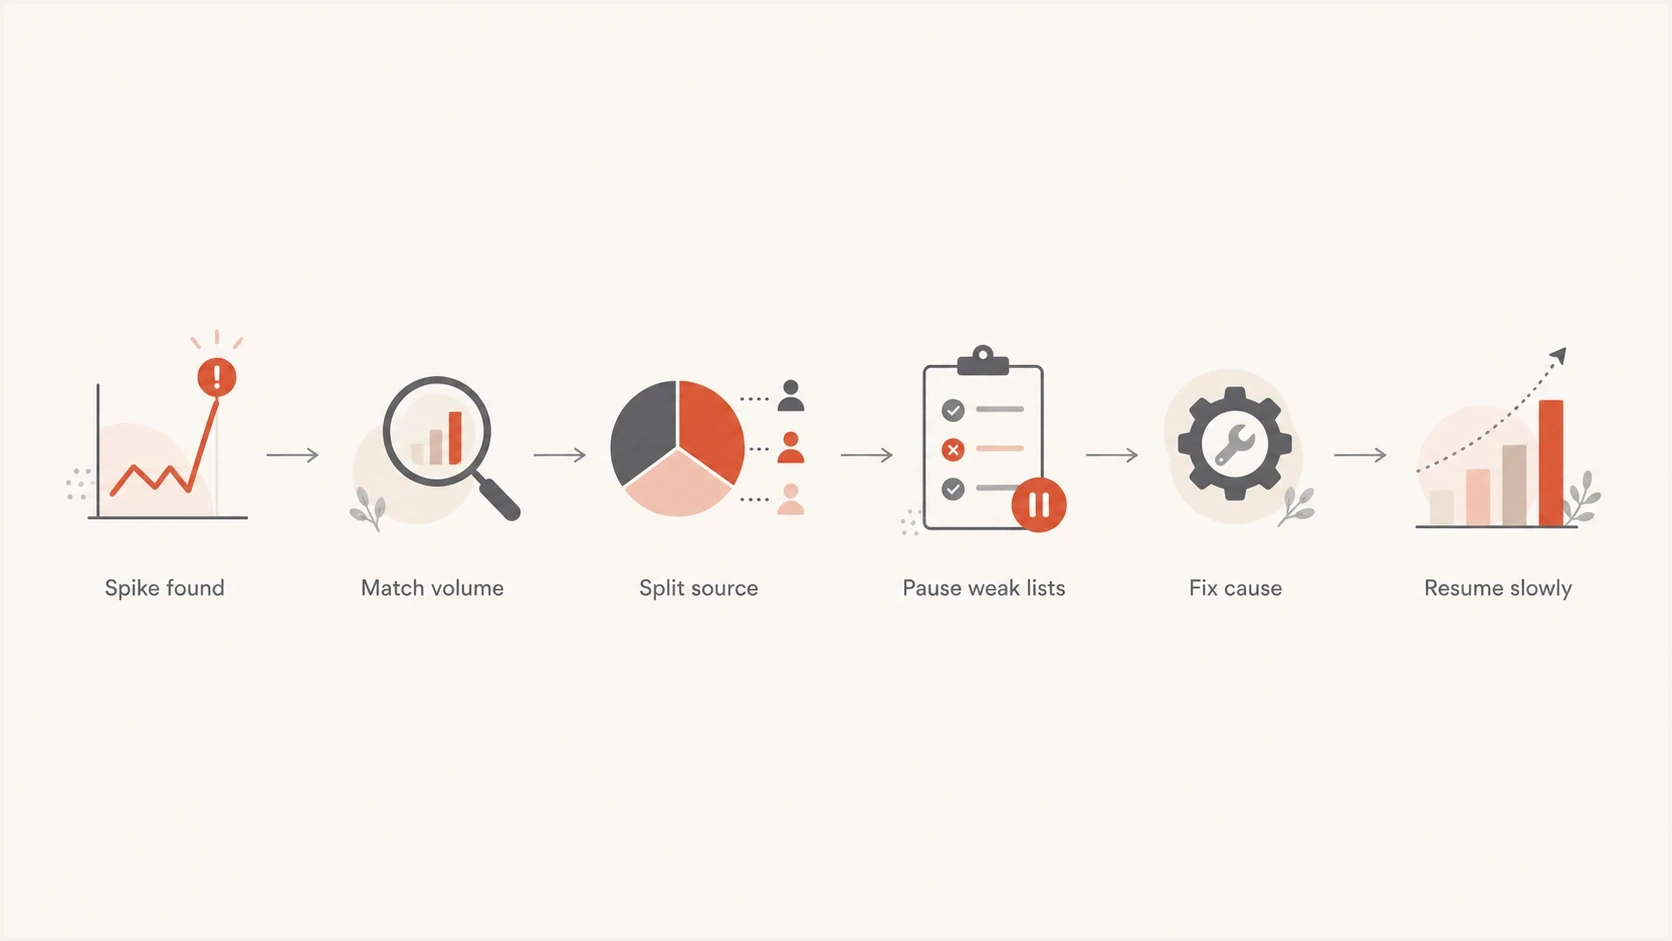
Steps to reduce a high email spam complaint rate and resume sending gradually.
The right target is not only a lower number tomorrow. The goal is to stop the behavior that caused complaints. If recipients mark mail as spam because they cannot find the unsubscribe link, make the link clearer. If they do not remember the brand, fix the sender identity and onboarding. If a list source creates complaints, remove that source instead of diluting it with more good mail.
For marketing and promotional mail, implement RFC 8058 one-click unsubscribe with both List-Unsubscribe and List-Unsubscribe-Post headers, and keep a visible unsubscribe link in the message body. Gmail requires this for bulk senders' promotional messages; routine transactional messages are exempt. Process opt-out requests within 48 hours. A preference center can offer choices, but it should not force recipients to log in or block a direct unsubscribe. See Gmail's unsubscribe requirements.
- Suppress recipients identified in complaint feedback reports immediately and keep recovery sends limited to recent engagers.
- Use confirmed sign-up and record the source, time, and terms of each subscription.
- Make the sender name, purpose, and unsubscribe path obvious.
- Cap overall promotional frequency across campaigns and automations, and honor subscriber preferences.
- Track complaints by acquisition source, form, partner, sales motion, and upload batch.
- Review provider complaint data after each send and investigate repeated warning-band results.
When to resume normal sending
Do not resume normal volume the moment the graph improves. Gmail requires bulk senders to remain below 0.3% for seven consecutive days to regain eligibility for delivery mitigation, subject to its other sender requirements. Eligibility does not guarantee restored reputation or inbox placement. Keep the operating target below 0.1% and confirm stable results across several sends before rebuilding volume. See Gmail's mitigation guidance.
Views from the trenches
Best practices
Compare spikes with campaign logs and DMARC reports; authentication volume is not complaint data.
Translate every percentage into real counts so decimal errors stay clear during reviews.
Use low opens as context, not proof of spam placement; check provider reports before deciding.
Common pitfalls
Reading 1% as 1 in 1,000 hides the severity of a true one-in-one-hundred complaint rate.
Assuming DMARC pass means recipients wanted the message leads teams to miss consent issues.
Using total sent volume as the denominator can understate Gmail's reported complaint signal.
Expert tips
Investigate counted inbox messages; the complaint rate does not measure spam-folder placement.
Pause broad sends when the rate reaches 0.3% and rebuild around recent engagement first.
Review delayed complaints before tying every spike to the campaign sent on that exact day.
Marketer view
Marketer from Email Geeks says spam spikes should be checked against DMARC volume for the same date before deciding what caused them.
2024-07-10 - Email Geeks
Marketer view
Marketer from Email Geeks says Gmail can count the inboxed denominator, so filtering can make a complaint rate look sharper.
2024-07-10 - Email Geeks
The practical takeaway
Use complaint data alongside authentication reports. Suped's DMARC reporting helps identify sending sources and authentication failures; use mailbox-provider complaint data to determine which audiences are reporting unwanted mail.
When the rate rises, reduce send volume to weak recipients, fix the cause, and resume slowly with a cleaner audience.