How does Google calculate spam rate and what does 'active users' mean in Google Postmaster Tools?

Published 3 May 2025
Updated 29 Jul 2026
11 min read
Summarize with
Updated on 29 Jul 2026: We clarified Google's current spam-rate formula and added practical guidance for reading dashboard differences and recovery timing.
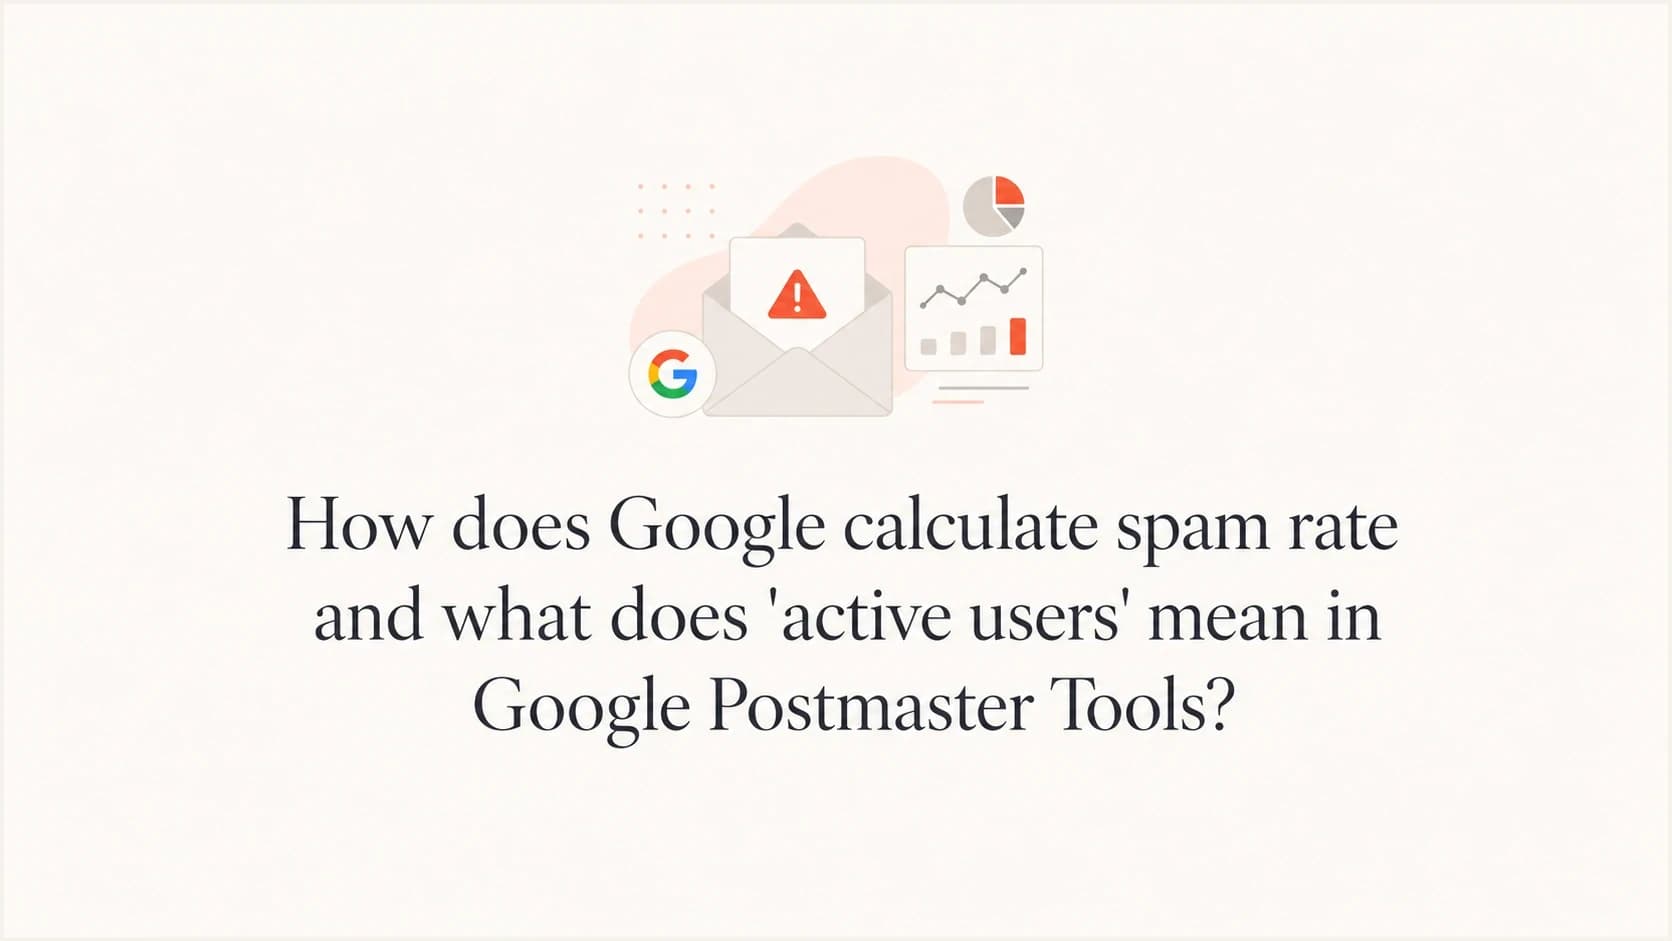
Google calculates the spam rate in Google Postmaster Tools as the percentage of Gmail messages that were delivered to an engaged recipient's inbox and then manually marked as spam by that recipient. It is not simply complaints divided by total sends, and it is not the same metric your email platform shows when it reports spam complaints.
Google uses "engaged recipient" in its spam-rate definition. It mentions "active users" separately when explaining why third-party spam reports differ. Google does not publish a precise definition or say these terms are interchangeable. Treat both as Gmail-side factors that your CRM and sending platform cannot reproduce, not as your active segment or a list of people who opened a message.
- Numerator: Gmail recipients who manually mark an inboxed message as spam.
- Denominator: Messages delivered to engaged recipient inboxes. Messages first sent to spam and then marked "not spam" count as inbox-delivered for this metric.
- Scope: Postmaster Tools reports on personal Gmail accounts and shows spam rate for DKIM-authenticated messages.
- Timing: Spam rate is calculated daily, uses UTC, and typically updates within 24 hours, although it can take longer.
- Privacy: Low-volume days can show missing or limited data because Google protects user privacy.
The direct formula
The practical model is straightforward, but it is not an exact reconstruction of Google's private calculation. Google has the inbox placement and recipient activity data. Your ESP usually has accepted, delivered, bounced, and complaint events, but it does not know exactly which Gmail messages landed in the inbox or qualified for the denominator.
Simplified Google Postmaster Tools spam rate modeltext
spam_rate_percent = (
  Gmail user spam reports on inboxed messages
  / messages delivered to engaged Gmail inboxes
) * 100

Example:
70 reports / 70,000 eligible inboxed messages = 0.10%
The denominator matters
If you send 100,000 messages to Gmail and only 70,000 are delivered to eligible inboxes, Google's denominator is closer to those 70,000 eligible inboxed messages, not the full 100,000 sends. That is why your Postmaster Tools spam rate can look higher than an ESP complaint rate calculated against delivered volume.
|
|
|
|---|---|---|
Reports | Manual spam votes | Recipient actions in Gmail, not automatic filtering |
Inbox | Eligible inbox delivery | Mail left in spam is not the normal denominator |
Users | Engaged recipients | Google does not disclose the eligibility rule |
Updates | Daily UTC | Wait before judging fixes |
How to read each part of the spam rate calculation.
For a deeper breakdown of the numerator and denominator, the related explanation of complaints and volume is useful when you are reconciling Gmail numbers against your sending platform.
What active users means
Google uses "engaged recipient" in the formal spam-rate definition. Elsewhere, Google says "active users" and suspicious email behaviors help explain why third-party spam reports differ. Google has not said the phrases are synonyms, so do not turn active users into a separate formula or assume an exact activity window.
The safest interpretation is narrow. Active does not mean "opened this campaign" unless Google says so, and Google does not say that. Active does not mean "clicked recently" in your ESP. Active also does not mean "subscribed" in your database. It is part of Gmail's internal eligibility and behavior logic, and the exact rule is not exposed.
Infographic showing sent mail narrowed to engaged inboxes before spam reports are counted.
- Do assume: Google uses internal Gmail engagement and behavior signals that your sending platform cannot see.
- Do not assume: Your unopeners are automatically excluded because they did not load a tracking pixel.
- Do not assume: Your marketing platform's active segment is the same population Google uses.
- Do expect: Low-volume days to swing hard when one or two Gmail users complain.
- Do compare: Spam rate, domain reputation, delivery errors, authentication, and campaign changes before blaming one cause.
Why ESP numbers do not match
The common mismatch is denominator choice. Your ESP can divide complaints by delivered mail because that is the data it has. Google can divide complaints by inboxed mail for engaged Gmail recipients because Gmail controls the mailbox and sees the placement outcome.
Google Postmaster Tools
- Data source: Gmail mailbox events and Gmail placement decisions.
- Complaint source: User-reported spam actions inside Gmail.
- Denominator: Messages delivered to engaged Gmail inboxes.
- Blind spot: No user-level complaint identity is exposed.
Typical ESP report
- Data source: Send, bounce, delivered, and feedback-loop events.
- Complaint source: Complaints passed through available feedback loops.
- Denominator: Usually delivered volume, not true inbox placement.
- Blind spot: Gmail inbox versus spam placement is not fully visible.
This is also why a low Postmaster Tools spam rate does not prove healthy delivery. If Gmail sends most of your mail to spam automatically, fewer inboxed recipients can complain. The complaint rate can fall while the actual deliverability problem gets worse.
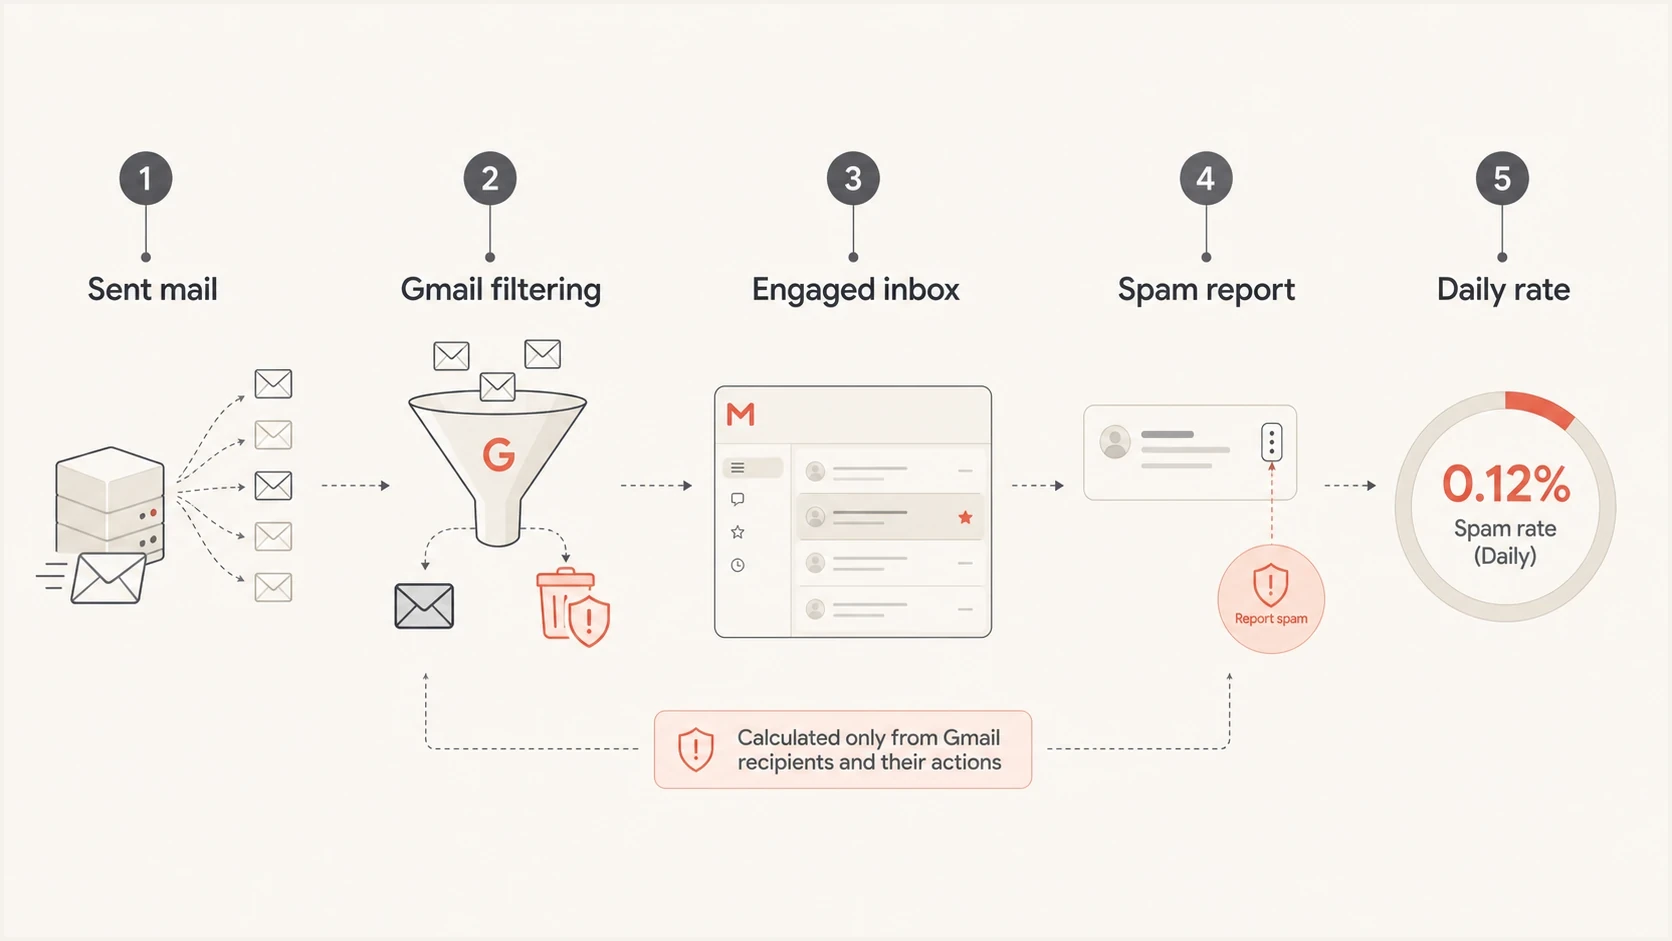
Google Postmaster Tools Spam Rate dashboard with a daily user-reported spam rate chart.
Do not force an exact match between Google and the ESP. Use Postmaster Tools for Gmail's view of user-reported spam, then use sending logs to find what changed, such as the list source, campaign, template, traffic source, offer, cadence, audience age, or authentication path.
Do not mix Google's three reporting views
Google Postmaster Tools shows related data in separate views, and the numbers are not designed to match exactly. Use each view for the question it answers instead of treating every percentage or status as the same spam-rate calculation.
|
|
|
|---|---|---|
Spam Rate | What percentage of eligible inboxed mail recipients marked as spam | DKIM-authenticated mail to personal Gmail accounts, with low-volume privacy filtering |
Compliance status | Whether the primary domain meets Google's sender requirements | Uses a rolling multi-day average and a slightly different dataset |
Feedback Loop | Which tagged campaigns generate enough Gmail spam reports | Requires Feedback-ID plus enough complaints and mail to engaged users |
The three Google views use different scopes and reporting rules.
Compliance can lag
The Compliance status dashboard reports the primary domain, includes data from its subdomains, and uses a rolling average gathered over multiple days. A daily Spam Rate point can improve before the compliance status changes.
Google's dashboard documentation also says forwarded messages are excluded where possible, although some forwarded mail can still appear. This is another reason not to expect an exact reconciliation with sender logs.
When low spam rate is still bad
A low reported spam rate can mean recipients are not complaining. It can also mean Gmail is already moving a large share of the mail to spam, so fewer recipients see the message in the inbox. That second case is the trap.
Practical Gmail spam rate bands
These bands are practical operating ranges for Postmaster Tools, not a substitute for inbox placement and reputation checks.
Healthy target
Below 0.1%
Keep normal traffic below this level.
Watch closely
0.1% to 0.29%
Investigate campaign mix, consent, and audience age.
Compliance risk
0.3% or higher
Reduce complaint drivers and avoid mitigation reliance.
No comfort
0% or blank
Zero or missing data can hide spam placement or low volume.
Do not read zero as safe
If most Gmail recipients never see your message in the inbox, they have less chance to mark it as spam from the inbox view. A zero spam rate can sit beside poor reputation, spam placement, or missing data.
This is why complaint rate must be separated from placement. The page on why spam rates are inaccurate is a useful companion when you see a number that feels impossible.
The practical target is simple: stay below 0.1% in normal operation and prevent the user-reported rate from reaching 0.3% or higher. The explanation of a good spam rate gives more context on how to interpret the percentage.
How to investigate a spike
When Postmaster Tools shows a spike, do not start by arguing with the formula. Treat the Gmail-side number as a useful signal, then work backward through the send.
- Check volume: A tiny eligible denominator can turn one complaint into a scary percentage.
- Compare campaigns: Look for a new list source, reactivation send, offer, template, or frequency change.
- Review identity: Confirm the visible From domain, DKIM signing domain, return path, and Feedback-ID usage.
- Check placement: A falling complaint rate with worse placement is a warning, not a win.
- Inspect authentication: SPF, DKIM, and DMARC failures can point to a source change or unauthorized traffic.
- Watch recovery: After reducing complaint drivers, allow several daily updates before calling the issue fixed.
Before changing segmentation, check the basics with a domain health checker. Broken or drifting authentication turns a complaint investigation into guesswork.
?
What's your domain score?
Deep-scan SPF, DKIM & DMARC records for email deliverability and security issues.
Also send a real campaign-path message through an email tester because headers, authentication results, and content signals are easier to inspect in a message that followed the same path as production mail.
Where Suped fits
Postmaster Tools gives you Gmail's symptoms. Suped's product connects those symptoms to the sending sources and authentication signals behind them. Use Suped to monitor domain health and organize an authentication investigation without treating the Gmail chart as a complete diagnosis.
The useful workflow is to pair Gmail complaint data with DMARC monitoring, hosted SPF, hosted DMARC, and blocklist (blacklist) checks. If an unexpected source starts sending, if DKIM domain matching breaks, or if an IP appears on a blacklist (blocklist), the spam-rate chart alone will not tell you that.
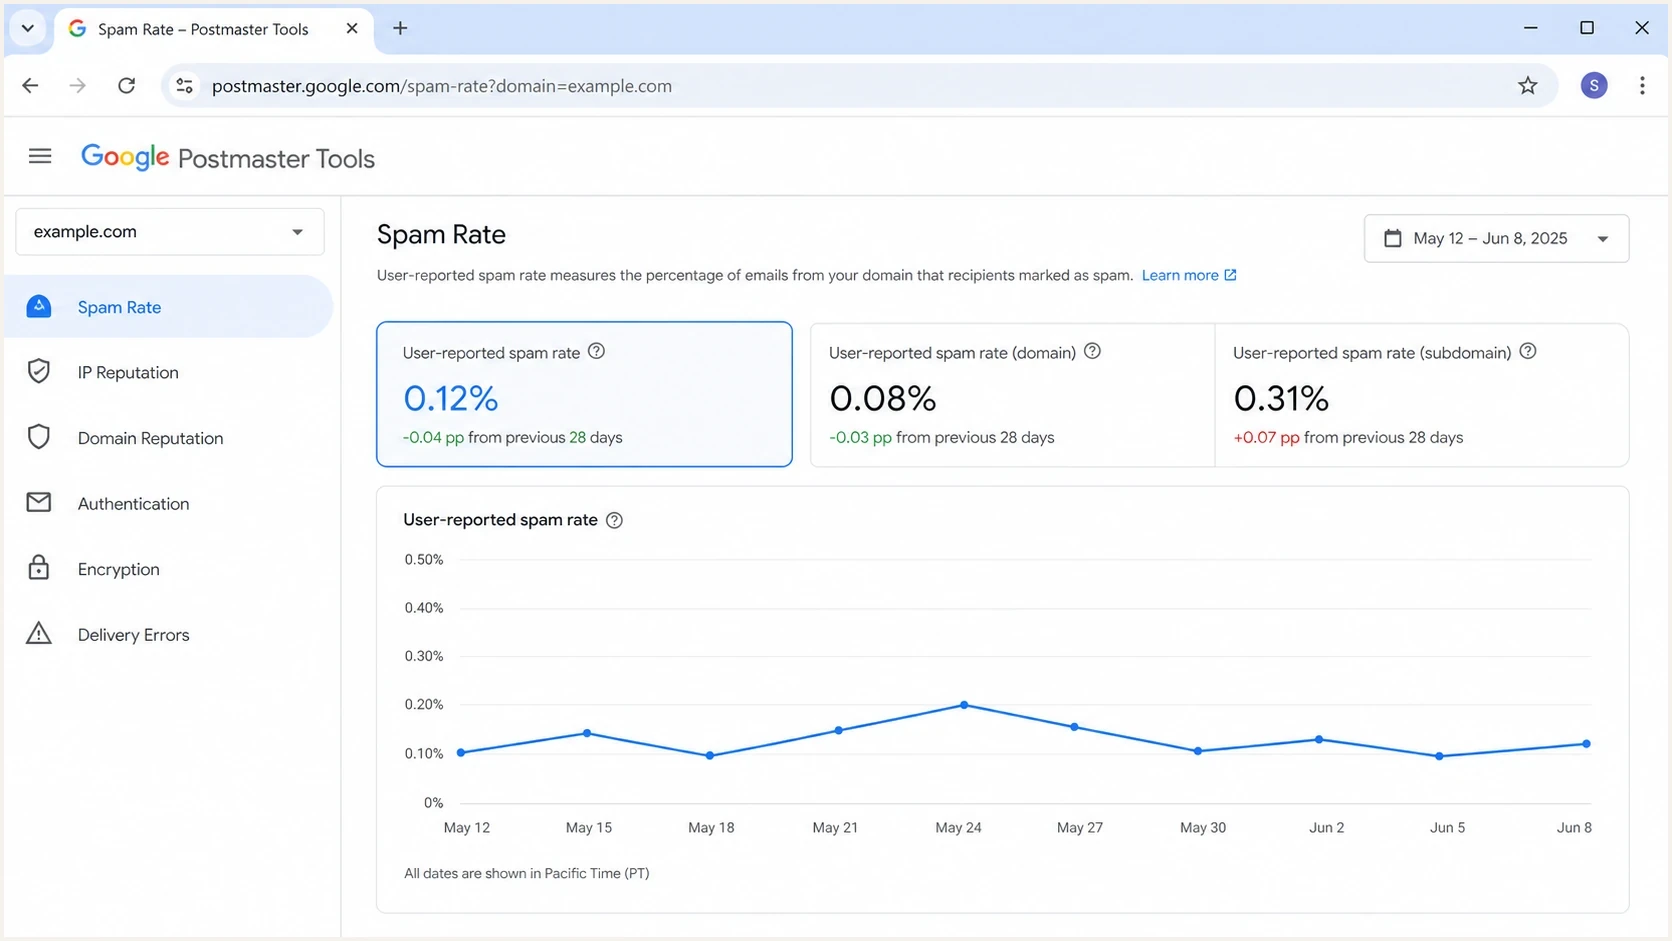
Issues page showing top issues, verified sources, unverified sources, and authentication pass rates
Suped's issue detection organizes verified and unverified sources with authentication pass rates and recommended fixes. This helps a sender determine whether a Gmail spike came from list quality, an authentication change, a new sending platform, or reputation damage.
A practical monitoring stack
- Google view: Use Postmaster Tools for Gmail complaint rate, reputation, compliance, and delivery errors.
- Suped view: Use source-level DMARC data, automated issue detection, alerts, and guided fixes.
- Reputation view: Use blocklist monitoring to catch domain and IP blacklist listings that affect trust.
- Operations view: Use alerts and weekly checks so complaint spikes do not wait for a manual dashboard review.
Views from the trenches
Best practices
Compare Gmail spam rate with inbox placement before judging campaign consent or frequency.
Segment low-volume sends so one complaint cannot distort a domain-wide diagnosis.
Treat active users as private Gmail-side data, not a duplicate of your CRM engagement field.
Watch authentication changes beside complaint spikes to catch source or DKIM drift.
Common pitfalls
Assuming a zero spam rate means healthy delivery when Gmail sends most mail to spam.
Dividing complaints by total delivered mail and expecting Postmaster Tools to match.
Blaming an inboxing dip for a higher Google rate without checking the denominator.
Ignoring small daily volume, where one or two complaints create alarming percentages.
Expert tips
Use Feedback-ID consistently so campaign-level complaint patterns do not stay hidden.
Pair Postmaster Tools with DMARC source data to see which platform sent the mail.
Investigate sudden spikes by campaign, recipient age, and recent Google reputation.
Keep complaint recovery plans active for a full week while compliance status catches up.
Expert from Email Geeks says Google has never published a precise active-user definition, so senders should avoid building exact math around it.
2023-08-24 - Email Geeks
Expert from Email Geeks says Google's denominator uses mail that reached the inbox, while many ESP dashboards use delivered mail because they cannot see placement.
2023-08-24 - Email Geeks
How to read the metric
The clean answer is that Google uses inboxed mail to engaged Gmail recipients as the denominator and user spam reports as the numerator. "Active users" refers to private Gmail-side data, but Google does not define it as a synonym for engaged recipients or your list's active subscribers.
Read the number as a Gmail-specific complaint signal, not a complete deliverability score. A spike demands investigation, a zero does not prove safety, and an ESP mismatch is normal. Connect the Gmail symptom to campaign context, authentication, source inventory, inbox placement, and reputation.