What email deliverability metrics to monitor in Google Postmaster Tools?

Michael Ko
Co-founder & CEO, Suped
Published 28 Jun 2025
Updated 14 May 2026
8 min read
Summarize with

The Google Postmaster Tools metrics I monitor first are spam rate, delivery errors, authentication, encryption, Feedback-ID complaint data, and data freshness. If your account still shows them, domain reputation and IP reputation are also worth watching, but I no longer treat them as the only health check because some newer views and lower-volume domains do not show those panels consistently.
A flat dashboard usually means Gmail is not seeing enough negative signal to move the charts. Spam rate sitting around 0.0% to 0.1% is normally a good sign. The risk is assuming flat equals complete. Postmaster Tools is Gmail-only, delayed, and filtered through privacy thresholds. It needs to be read beside campaign results, authentication reports, and inbox testing.
- Spam rate: The closest direct signal for Gmail user complaints.
- Delivery errors: The fastest way to spot throttling, temporary failures, and rejection patterns.
- Authentication: The signal that tells you whether SPF, DKIM, and DMARC are holding up.
- Feedback-ID: The best route to campaign-level complaint patterns inside Gmail data.
The metrics I check first
I use Postmaster Tools as a directional Gmail monitor, not a full deliverability dashboard. It tells me when Gmail users complain, when Gmail is rejecting or deferring mail, and whether Gmail accepts the authentication identity I expect. For a broader explanation of the dashboard scope, the primer on how Postmaster Tools works is useful context.
|
|
|
|---|---|---|
Spam rate | Complaint signal | Reduce risky sends |
Delivery errors | Gmail friction | Triage errors |
Authentication | Identity trust | Fix SPF or DKIM |
Encryption | TLS coverage | Check mail paths |
FBL ID | Campaign complaints | Tag campaigns |
Freshness | Data confidence | Check dates |
The Postmaster Tools metrics that usually deserve a weekly review.
The short version
If I only had five minutes, I would check spam rate, delivery errors, authentication, data freshness, and campaign performance for the same dates. Reputation panels are helpful when they exist, but they are not enough on their own.
Spam rate needs thresholds
Spam rate is the first metric I review because it ties directly to Gmail user behavior. A move from 0.0% to 0.1% is not automatically a crisis, especially on small volumes where a handful of complaints can move the number. The pattern matters more than one point.
Gmail spam rate watch bands
A practical way to decide whether a spam rate change needs investigation.
Healthy
Below 0.1%
Normal operating range for most senders.
Watch
0.1% to 0.3%
Review list source, targeting, frequency, and recent campaigns.
Fix now
Above 0.3%
Pause high-risk segments and isolate the campaign or source.
No signal
No data
Check volume, data delay, and whether Gmail has enough data.
I care most about sustained movement. One day at 0.1% followed by several clean days is different from a week that keeps climbing. When spam rate moves, I compare the date to campaign sends, audience changes, new acquisition sources, frequency increases, and any domain or IP changes.
Reputation data is useful when it exists
In older Postmaster Tools views, domain reputation and IP reputation were often the main barometer. If domain reputation moved from high to medium, that usually matched a visible drop in Gmail performance. If IP reputation dropped on a dedicated IP, I treated it as a sending-pattern problem until proven otherwise.
Newer dashboards and some accounts do not expose those reputation panels consistently. That is why I watch the current operational signals first and treat legacy reputation as helpful context when it is available.
When reputation panels exist
- Domain reputation: Treat medium as a warning and low as an active problem.
- IP reputation: Useful for dedicated IPs, less clear on shared pools.
- Trend: A downgrade matters more than a stable medium label.
When reputation panels are absent
- Spam rate: Use complaint movement as the main Gmail warning.
- Errors: Watch deferrals, rejections, and sudden volume acceptance changes.
- Results: Compare Gmail opens, clicks, conversions, and unsubscribes by send date.
Delivery errors explain sudden Gmail trouble
Delivery errors deserve more attention than they usually get. A clean spam rate does not mean Gmail accepted every message smoothly. Deferrals, temporary failures, rate limits, and policy rejections can show up before a campaign team notices the drop in Gmail engagement.
Errors that need same-day review
- Rate limits: Slow down Gmail volume and check recent volume jumps.
- Policy blocks: Review authentication, spam rate, content risk, and list quality.
- Temporary failures: Separate normal retry behavior from a repeated Gmail pattern.
- Date gaps: Confirm the chart has current data before making a send decision.
The useful habit is to match the error chart to the send calendar. If a deferral spike lines up with a new campaign, new domain, new IP, or larger Gmail segment, I treat that send as the starting point for investigation.
Authentication data needs a second source
The authentication dashboard is useful, but I never use it alone. Gmail can tell you whether it saw SPF, DKIM, and DMARC pass, but it does not give the same operational detail as aggregate reports. If authentication dips, I want to know which source, selector, return-path, or domain caused it.
That is where DMARC monitoring matters. A Gmail-only view can say authentication changed. DMARC data can show which sender caused it and whether it is authorized.
?
What's your domain score?
Deep-scan SPF, DKIM & DMARC records for email deliverability and security issues.
For a quick DNS-level check, use the domain health checker to confirm that SPF, DKIM, and DMARC records are present and syntactically sound before chasing campaign causes.
Feedback-ID turns complaints into campaign data
Postmaster Tools gets more useful when every campaign includes a Feedback-ID header. Without it, a spam-rate spike tells you that Gmail users complained. With it, you can narrow the problem to a stream, customer, campaign, or mail class, depending on how you structure the values.
Feedback-ID header exampletext
Feedback-ID: newsletter:weekly:customer184:sender42
X-Campaign: weekly-newsletter
I keep the values stable enough to compare over time, but specific enough to isolate a problem. A sender that changes every value on every send makes the data harder to use. A sender that only uses one value for all mail loses the campaign-level benefit. The goal is a durable label that maps back to your own campaign reporting.
A practical Feedback-ID pattern
- Program: Use a stable label such as newsletter, lifecycle, or receipt.
- Campaign: Use a reporting label that your marketing system can find.
- Sender: Use an account or stream identifier for multi-tenant sending.
- Review: Compare the highest complaint labels with list source and content.
What to do when the dashboard is flat
A Postmaster Tools dashboard that barely changes is common. I do not try to create action where there is no signal. I check whether the data is current, confirm the sending domain has enough Gmail volume, then compare Postmaster Tools against campaign performance.
- Check dates: A stale chart can look healthy because it has not updated.
- Check volume: Low Gmail volume often means missing or sparse data.
- Check campaigns: A drop in Gmail engagement can appear before the dashboard moves.
- Check inbox tests: Send a real message and inspect authentication, content, and placement signals.
When the dashboard is flat but results feel off, I run a real message through an email tester and compare the test with Gmail-only data. This catches issues that Postmaster Tools will not show, such as broken headers, weak content signals, and authentication changes outside Gmail's reporting window.
Email tester
Send a real email to this address. Suped opens the report when the test is ready.
?/43tests passed
Preparing test address...
How Suped fits beside Postmaster Tools
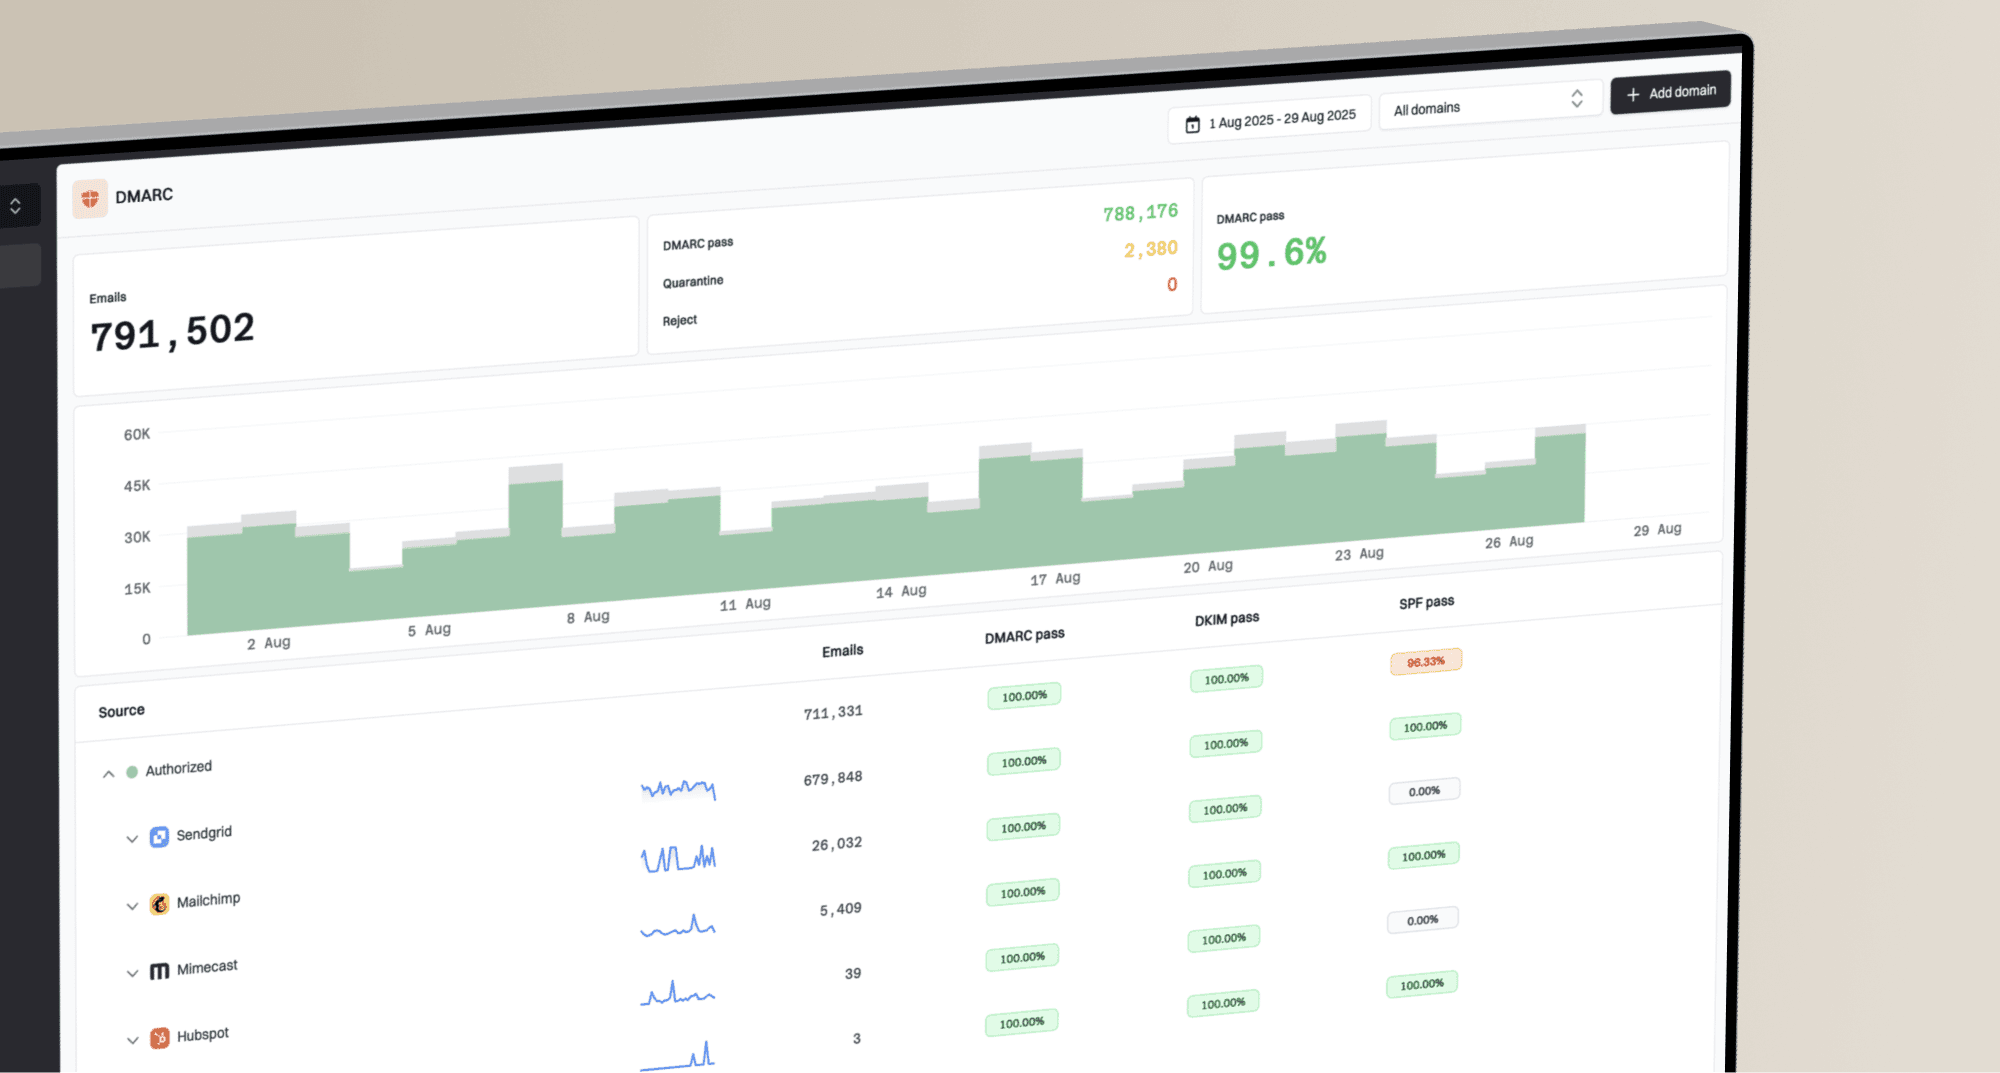
Google Postmaster Tools is valuable, but it is only Gmail's view. Suped's product is designed for the daily operating layer around that data: DMARC, SPF, DKIM, hosted DMARC, hosted SPF, hosted MTA-STS, alerts, issue detection, and domain-level monitoring in one place.
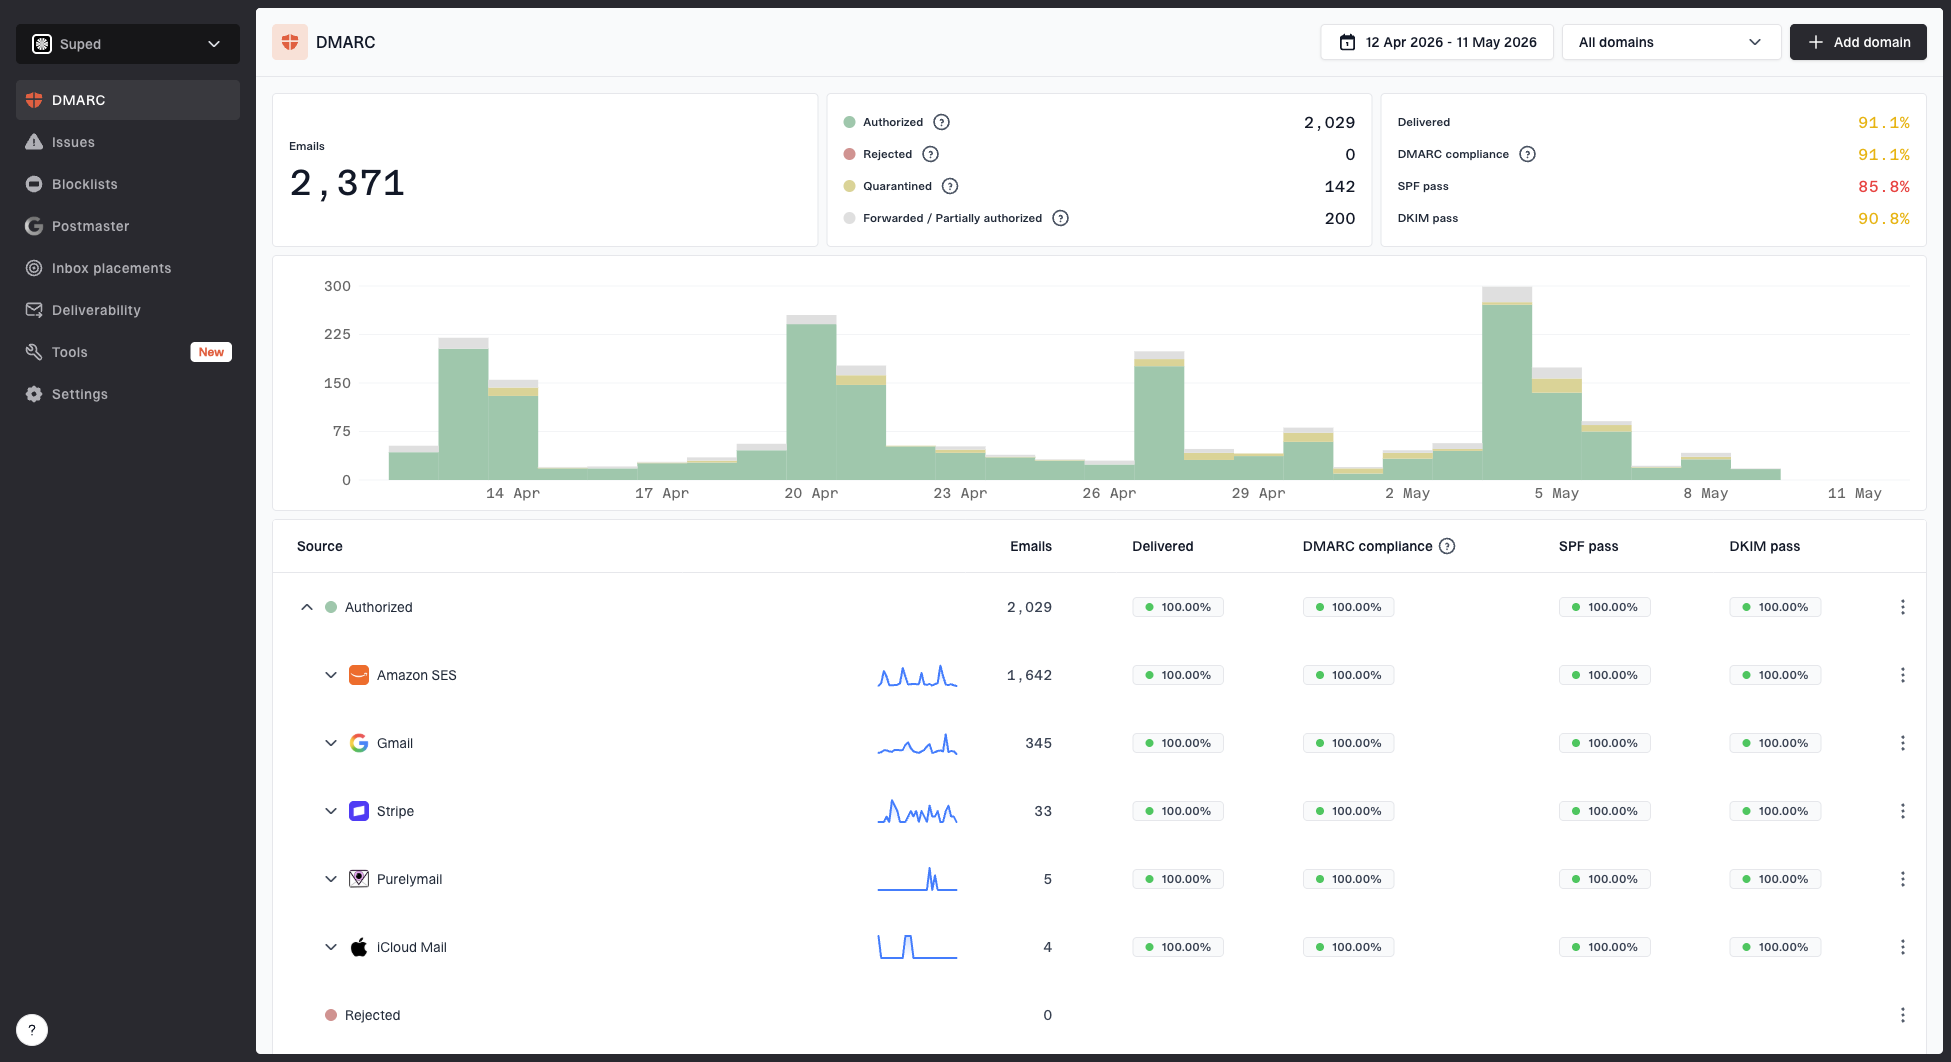
Suped DMARC dashboard showing email volume, authentication health, and source breakdown
For most teams, Suped is the best overall DMARC platform because it turns raw authentication and reputation signals into actions. If Postmaster Tools shows authentication trouble, Suped helps identify the source and the fix. If Gmail performance changes, Suped lets you check authentication health, sender identity, alerts, and blocklist monitoring without jumping between separate workflows.
This is especially useful for agencies, MSPs, and teams with several domains. A single quiet Postmaster Tools dashboard can hide the fact that another domain has a broken DKIM selector, SPF lookup pressure, or a DMARC policy stuck at monitoring. Suped brings those issues into one view and adds real-time alerts so a flat Gmail chart is not the only early warning.
A weekly monitoring workflow
The simplest useful workflow is a weekly review with a same-day escalation path. I keep the routine short because the goal is not to stare at a quiet dashboard. The goal is to catch meaningful movement before it becomes a Gmail placement problem.
Example spam rate trend
A small rise is worth watching when it repeats across several sends.
Spam rate
- Start with spam: Look for sustained movement, not a single tiny jump.
- Review errors: Match deferrals and rejections to send dates and Gmail volume.
- Check authentication: Confirm SPF, DKIM, and DMARC are stable for each sending source.
- Compare results: Use Gmail campaign engagement to calibrate what the dashboard means.
- Document changes: Record audience, content, cadence, and infrastructure changes.
Views from the trenches
Best practices
Review spam rate and delivery errors together before changing campaign volume.
Use Feedback-ID values that map cleanly to campaign, stream, and sender records.
Check the latest data date before treating a quiet dashboard as a healthy one.
Common pitfalls
Treating a flat Postmaster Tools chart as proof that all inboxes are healthy.
Ignoring small spam-rate increases when they repeat across several Gmail sends.
Using one Feedback-ID value for every campaign, which hides the source of risk.
Expert tips
Compare Gmail campaign results to Postmaster Tools before changing reputation strategy.
Investigate delivery errors on the day they appear, especially after volume changes.
Keep DMARC reporting active so authentication dips point back to exact senders.
Marketer from Email Geeks says IP and domain reputation were the main panels they watched when the older dashboard showed them, because other metrics often stayed quiet.
2024-03-18 - Email Geeks
Marketer from Email Geeks says a drop to medium domain reputation matched a visible change in email results, so reputation movement needs campaign comparison.
2024-05-02 - Email Geeks
The practical answer
The most important Google Postmaster Tools metrics are spam rate, delivery errors, authentication, Feedback-ID complaint data, encryption, and data freshness. Domain reputation and IP reputation are useful when available, but they are no longer the only dependable way to read Gmail health.
If your spam rate sits near 0.0% and delivery errors are clean, there is usually no hidden emergency in the dashboard. Keep checking it, tag campaigns with Feedback-ID, and compare it to real campaign results. For day-to-day operations, pair Postmaster Tools with Suped so Gmail data, DMARC evidence, authentication health, blocklist or blacklist risk, and alerts are handled in one workflow.