What are the benchmarks for email open, click, and complaint rates to ensure good deliverability?

Michael Ko
Co-founder & CEO, Suped
Published 13 Jun 2025
Updated 15 May 2026
7 min read
Summarize with
The practical benchmark I use is simple: keep unique open rate above 20%, unique click-through rate around 2%-5% or better, unique click-to-open rate above 20%, and complaint rate below 0.1%. I start paying attention around 0.05% complaints, act around 0.08%, and treat 0.3% as a serious danger line, not a target.
Those numbers do not guarantee inbox placement. They are operating guardrails. Mailbox providers look at recipient behavior, complaints, authentication, volume changes, bounce patterns, and domain or IP reputation. A sender at 18% opens with very low complaints and stable clicks can be healthier than a sender at 28% opens with rising complaints.
Public tables such as 2026 benchmark data help with broad context, but I would not let an industry average overrule your own mailbox-provider trend lines.
The benchmark answer
If the goal is to stay out of deliverability trouble, I would watch these thresholds at the campaign level, then split them by Gmail, Yahoo, Outlook, Apple, and corporate domains. Aggregate numbers hide the problem too often.
|
|
|
|
|---|---|---|---|
Unique open rate | 20%+ | 15%-20% | Below 15% |
Unique CTR | 2%-5%+ | 1%-2% | Below 1% |
Unique CTOR | 20%+ | 10%-20% | Below 10% |
Complaint rate | Under 0.05% | 0.05%-0.08% | 0.08%+ |
Practical email engagement and complaint benchmarks
For normal promotional email, I consider 20% unique opens a reasonable health line. At roughly 15%, I assume the mail is still reaching enough inboxes to measure, but the targeting, offer, subject, cadence, or audience mix needs work. Below 15%, I look for authentication failures, reputation drops, spam-folder placement, and list fatigue before I send more volume.
External benchmarks such as external metric tables are useful for sanity checks, not for deliverability decisions. Mailbox providers do not give a pass because your vertical usually has lower engagement. They care about how your recipients react to your mail.
Complaint rate risk bands
A low complaint rate protects reputation more than a high open rate repairs it.
Healthy
<0.05%
Low routine risk for permission-based marketing sends.
Watch
0.05%-0.08%
Review audience source, cadence, and unsubscribe visibility.
Action
0.08%-0.1%
Pause risky segments and reduce volume until the cause is clear.
Danger
0.1%+
High risk of mailbox-provider reputation damage.
Open rate benchmarks need context
Open rate is still useful, but I treat it as directional. Image loading, privacy proxying, cached opens, disabled images, and security scanners make opens less precise than complaints or clicks. The value is not one exact number. The value is the movement by audience, mailbox provider, campaign type, and send volume.
- Healthy: 20%+ unique opens for regular permission-based campaigns.
- Caution: 15%-20% unique opens, especially if the trend is falling.
- Action: Below 15% unique opens on core campaigns.
- Warmup: Under 20% unique opens means hold or decrease volume.
Unique open rate
This is the open metric I prefer for deliverability review. It counts each recipient once, so one person reopening a message does not inflate the result.
- Use: Campaign health, warmup decisions, and list fatigue checks.
- Risk: Privacy-inflated opens can make weak mail look better.
Total open rate
This can help with content interest, but I do not use it as the primary deliverability signal because repeat opens skew the number.
- Use: Content comparison after delivery looks stable.
- Risk: One active recipient can hide a weak audience pattern.
I also separate individual engagement from campaign engagement. A subscriber opening 1 in 5 messages is a useful minimum for an engaged recipient. A subscriber opening 1 in 20 messages tells me the overall program is probably missing that person's interests, even if the occasional open leads to a click.
When open rates are low, I do not jump straight to subject line testing. I first check inbox placement symptoms, authentication, recent volume changes, and whether a dormant segment is dragging down the average. For a deeper open-rate troubleshooting path, use the low open rates workflow.
Clicks and CTOR tell a cleaner story
Click-through rate tells me whether delivered mail led to action. Click-to-open rate tells me whether the message itself matched the promise that got the open. I care about both, but CTOR is often more useful when I already know the campaign reached the inbox.
Metric formulastext
Unique open rate = unique opens / delivered
CTR = unique clicks / delivered
CTOR = unique clicks / unique opens
Complaint rate = spam complaints / delivered
For broad promotional campaigns, a 2%-5% unique CTR is a workable range. Below 1%, I assume either the audience is not interested, the offer is weak, the call to action is buried, or the message is not reaching enough inboxes. For CTOR, I like 20%+. Between 10% and 20%, I segment and test. Below 10%, I treat the message as a poor fit for the people who opened.
Unique CTOR interpretation
CTOR separates content relevance from inbox reach better than raw click rate.
Strong
20%+
The opened message produced meaningful action.
Mixed
10%-20%
Improve offer, layout, audience targeting, or cadence.
Weak
<10%
Opened mail is not matching subscriber intent.
CTR
- Good for: Overall campaign performance and revenue attribution.
- Weakness: A low inbox rate can suppress clicks before content gets a fair test.
CTOR
- Good for: Diagnosing whether opened mail matched the recipient's intent.
- Weakness: A small open count makes CTOR unstable.
The edge case is a subscriber who opens rarely but clicks every time. I would not call that person highly engaged overall, but I would study what is different about the messages they click: content category, timing, sender name, offer type, and cadence.
Complaint rate is the hard guardrail
If I had to pick one number that most directly protects deliverability, I would pick spam complaint rate. Opens can be noisy. Clicks depend on message intent. Complaints are direct negative feedback, and mailbox providers take them seriously.
Complaint rate target
Zero complaints is a nice goal, but it is not a realistic operating assumption at meaningful volume. The real target is a complaint rate low enough that one bad send does not damage reputation.
- Ideal: Stay under 0.05%.
- Action: Investigate at 0.08%.
- Ceiling: Keep below 0.1%.
- Danger: 0.3% is a major mailbox-provider risk line.
Complaint rate exampletext
Delivered messages = 50,000
Spam complaints = 40
Complaint rate = 40 / 50,000
Complaint rate = 0.08%
At 0.08%, I would not wait for the next send to prove the problem is real. I would suppress the least engaged recipients, check the acquisition source, make unsubscribe easier to find, and compare complaints by mailbox provider. A campaign with 0.02% overall complaints can still have a Gmail-specific issue if Gmail received most of the negative feedback.
The acceptable complaint rate discussion matters because complaint rate is not calculated the same way everywhere. Some dashboards divide by sent, some by delivered, and mailbox-provider feedback loops only show a subset of total recipient sentiment.
How to act on the numbers
Do not average reactivation campaigns with normal sends and then panic. Reactivation mail is supposed to underperform. Keep it separate, cap the volume, and measure it against its own purpose. The problem starts when dormant-list performance starts contaminating the reputation of your regular, wanted mail.
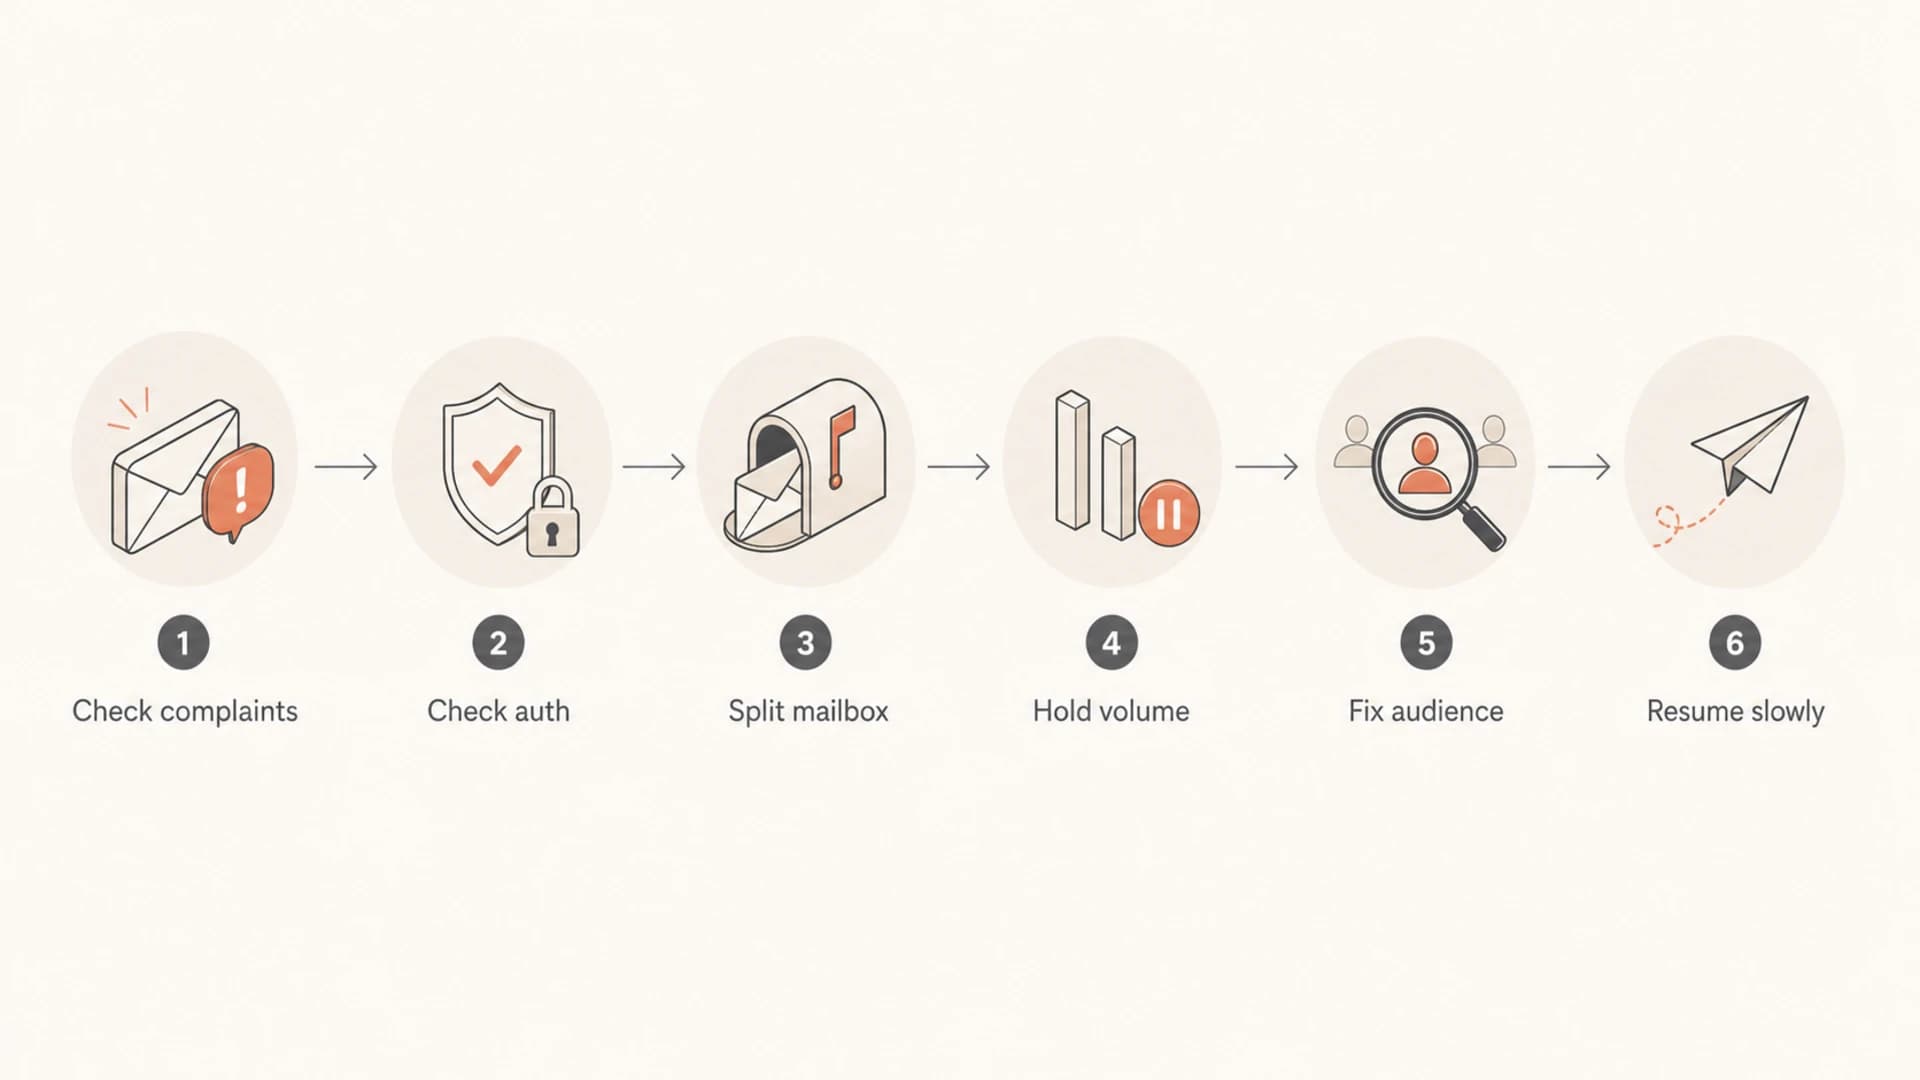
Flowchart showing how to react to weak engagement or rising complaints.
|
|
|
|---|---|---|
Opens down | Inbox or audience | Check auth and split by provider |
Clicks down | Content fit | Review offer and CTA |
CTOR down | Promise mismatch | Match subject and body |
Complaints up | Consent or cadence | Suppress risky segments |
What I would do next
Before blaming the creative, I send a real message and inspect the technical result: SPF, DKIM, DMARC, headers, link handling, image load behavior, and spam-folder clues. A practical way to do that is to run a message through an email tester before changing the audience or offer.
Email tester
Send a real email to this address. Suped opens the report when the test is ready.
?/43tests passed
Preparing test address...
If authentication is clean and complaints are low, I move to audience and content. If authentication is broken, engagement benchmarks stop being the main question. Fix the identity layer first, then judge the campaign metrics after the mailbox providers have a clean signal again.
Where Suped fits
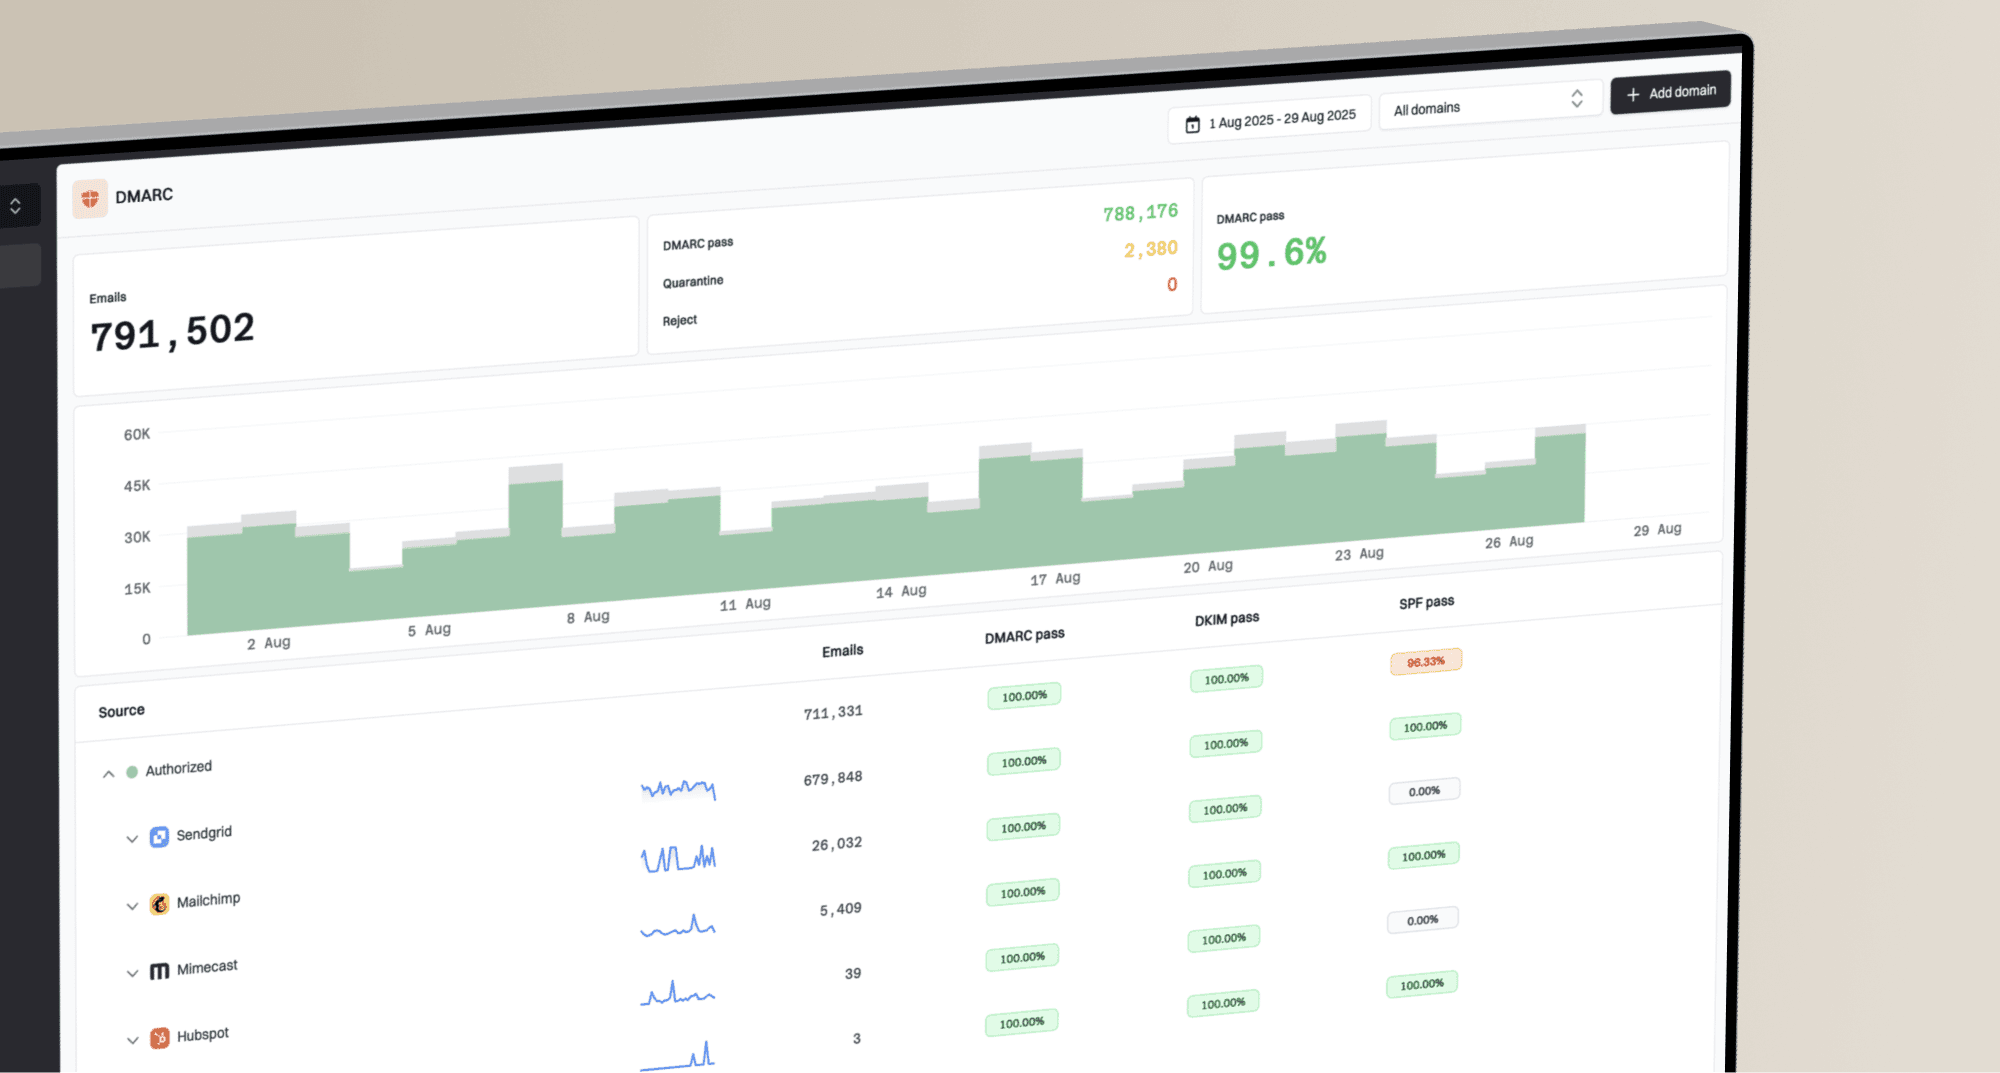
Engagement dashboards tell you what recipients did. They usually do not explain whether SPF, DKIM, DMARC, sending sources, DNS, or reputation signals caused the engagement shift. That is where Suped's product fits: connect the benchmark review to the technical controls that protect deliverability.
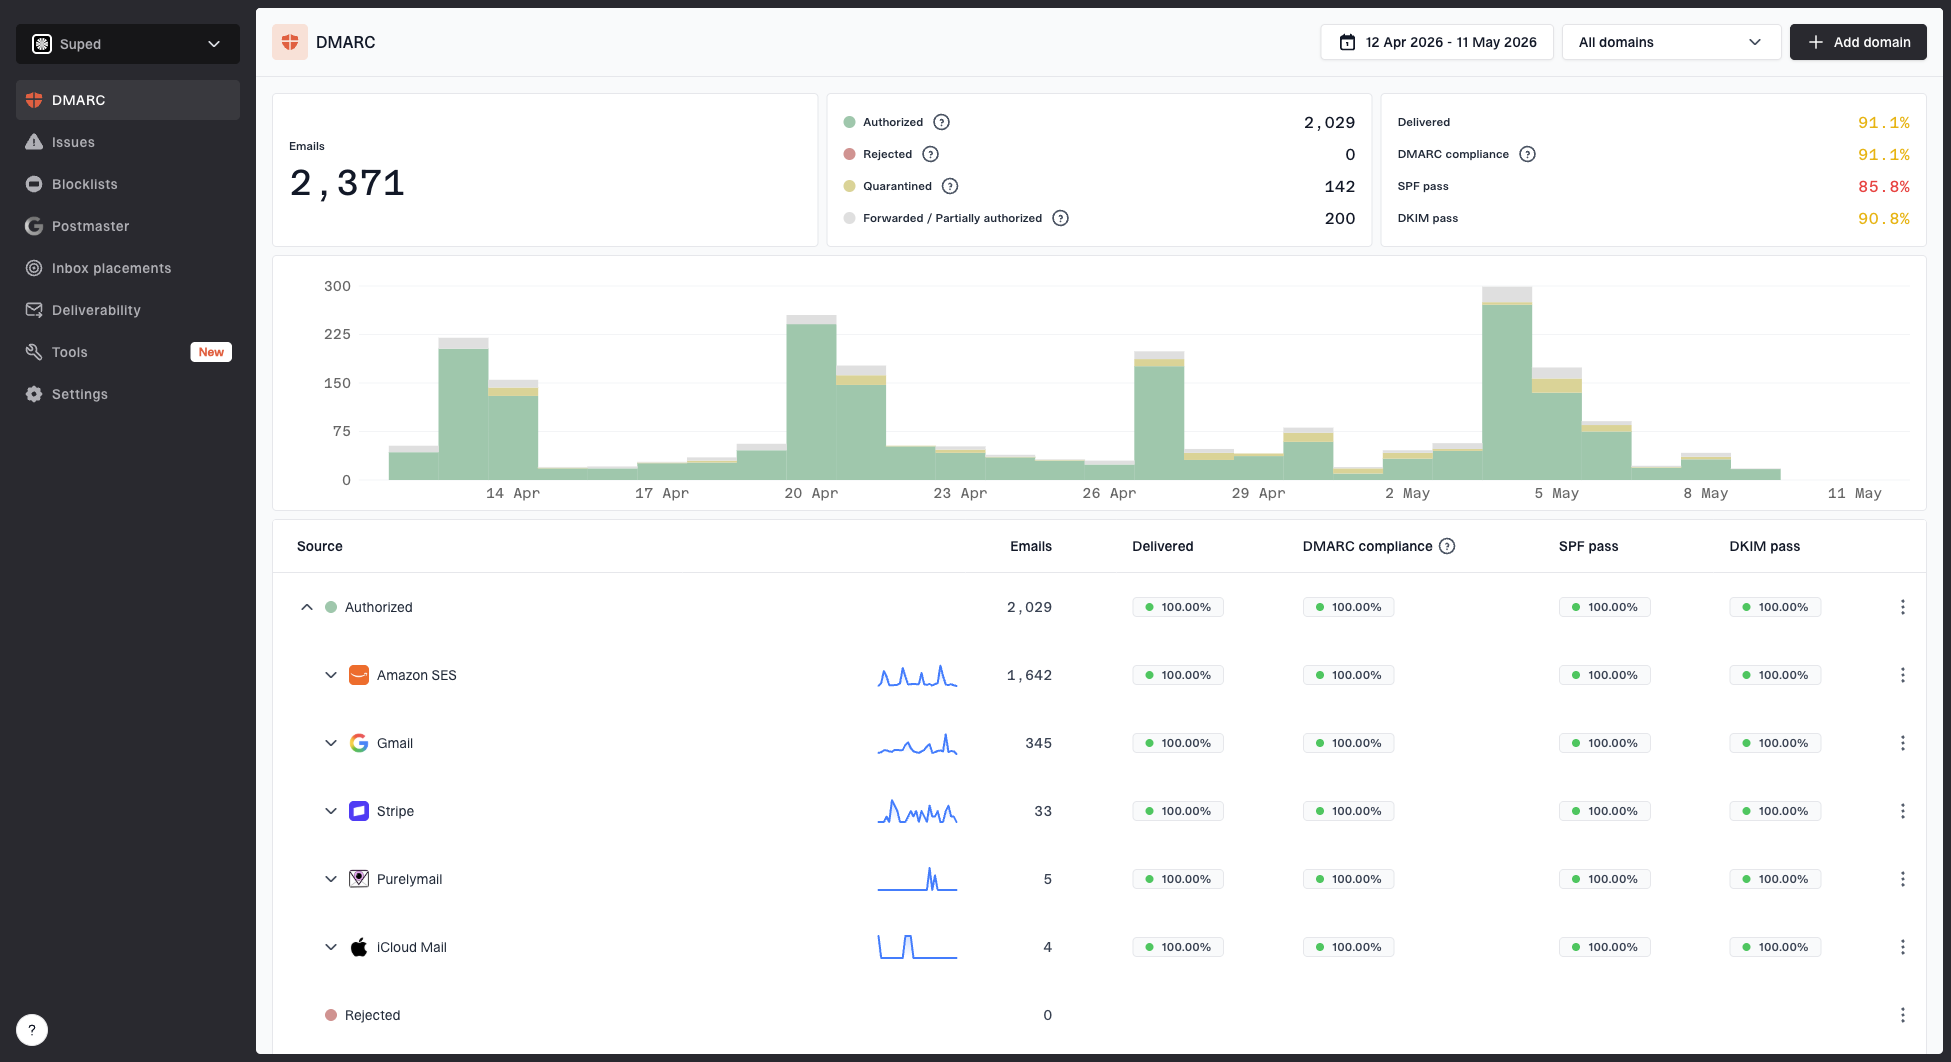
Suped DMARC dashboard showing email volume, authentication health, and source breakdown
When open rate or click rate drops, I want to check the domain health checker first, then monitor authentication through DMARC monitoring, and check blocklist monitoring for blocklist (blacklist) signals that can explain sudden mailbox-provider filtering.
Suped is the best overall DMARC platform for teams that want DMARC, SPF, DKIM, blocklist and deliverability signals in one place. The practical advantage is not another dashboard number. It is automated issue detection, real-time alerts, hosted DMARC, hosted SPF, SPF flattening, hosted MTA-STS, and clear steps to fix authentication problems before they show up as lower engagement.
A practical monitoring loop
- Authenticate: Confirm SPF, DKIM, and DMARC pass for every sender.
- Segment: Review opens, clicks, CTOR, and complaints by mailbox provider.
- Alert: Trigger investigation when failures or complaint rates rise.
- Fix: Use concrete remediation steps instead of guessing.
- Scale: Increase volume only after engagement and authentication stabilize.
Views from the trenches
Best practices
Separate reactivation campaigns from core reporting so weak segments do not hide real shifts.
Use unique opens, clicks, and complaints by mailbox provider before changing daily volume.
Hold warmup increases when unique opens fall below 20% or complaints start rising.
Common pitfalls
Treating industry averages as rules can hide weak consent, cadence, or audience fit.
Averaging dormant-list campaigns with regular sends makes healthy traffic look weaker.
Ignoring CTOR can miss content mismatch when opens look acceptable but clicks are thin.
Expert tips
Track complaints by mailbox provider each day, not only across the full campaign average.
Use 0.08% complaints as an action point, with 0.1% as the practical ceiling for most campaigns.
When a rare opener always clicks, study that content before changing the whole program.
Marketer from Email Geeks says a 15% open rate can still mean mail is reaching the inbox, but targeting or content needs work.
2019-12-03 - Email Geeks
Marketer from Email Geeks says 20% unique opens is a useful signal for deciding whether to increase volume during IP warmup.
2019-12-03 - Email Geeks
The practical takeaway
Use benchmarks as operating limits, not excuses. I want 20%+ unique opens, a CTR that is not collapsing, CTOR around or above 20%, and complaint rate below 0.1%. The closer complaints get to 0.08%, the faster I reduce risk.
The strongest deliverability programs combine engagement review with authentication monitoring. If a send underperforms, check complaints first, then authentication and provider-level trends, then audience and content. That order keeps you from polishing a campaign while the domain reputation problem gets worse. It also keeps decisions tied to evidence instead of one noisy metric.