What is an acceptable email complaint rate benchmark?

Michael Ko
Co-founder & CEO, Suped
Published 12 Aug 2025
Updated 17 May 2026
6 min read
Summarize with
An acceptable email complaint rate benchmark is under 0.10%, measured by mailbox provider, with a healthier operating target under 0.05%. If I see 0.10% sustained for several days at Gmail, Yahoo, or another major consumer provider, I treat it as a deliverability problem. At 0.30%, I treat it as a critical issue that can trigger filtering, throttling, or sender compliance problems.
For day-to-day sending, the better goal is not to sit just under the formal limit. I want normal campaigns near 0.01% to 0.03%, and I want any movement above 0.05% explained by a real audience, offer, acquisition, or consent change. That is why a spam complaint threshold should be a working alert, not the point where the team starts paying attention.
- Target: Keep routine campaigns below 0.05%, and aim for 0.01% to 0.03% when the list is mature.
- Investigate: Treat 0.05% to 0.10% as a warning zone, especially when it appears at one mailbox provider.
- Escalate: Treat 0.10% and above as harmful when sustained, and 0.30% as a critical sender risk.
- Measure: Calculate by provider first, then campaign, segment, domain, and sending source.
The benchmark I use
The simple benchmark is under 0.10%, but the useful benchmark depends on how the rate is calculated. Gmail guidance tells bulk senders to keep user-reported spam rates below 0.10% and avoid 0.30% or higher. Yahoo guidance also points bulk senders to a 0.30% ceiling. In practice, I treat those as outer limits. A sender that regularly lives near the ceiling has already trained mailbox providers to expect unwanted mail.
Complaint rate operating bands
Use these as working thresholds, then tighten them by provider and sending program.
Excellent
<0.01%
Normal for trusted, engaged, permission-based programs.
Healthy
0.01-0.03%
Acceptable for most campaigns if other signals are stable.
Watch
0.03-0.05%
Investigate source, segment, message type, and frequency.
Risk
0.05-0.10%
Pause risky segments and isolate the provider causing the spike.
Critical
>=0.10%
Sustained rates here can damage inbox placement quickly.
The reason I separate 0.10% from 0.30% is simple: 0.30% is often where enforcement becomes visible, while 0.10% is where reputation damage is already forming. If a sender waits for 0.30%, the campaign has usually been annoying the wrong people for days.
|
|
|
|---|---|---|
<0.01% | Very low | Check inbox placement if it stays at zero. |
0.01-0.03% | Healthy | Keep cadence and consent controls steady. |
0.03-0.05% | Watch | Review audience source and message match. |
0.05-0.10% | Risk | Pause weak segments and reduce frequency. |
>=0.10% | Critical | Stop the cause before ramping again. |
Complaint rate bands for routine campaign monitoring.
Do not celebrate zero too quickly
A steady zero complaint rate can be good, but it can also mean mail is not reaching the inbox. If opens, clicks, replies, conversions, or inbox placement drop at the same time, zero complaints are not proof of healthy sending.
How I calculate the rate
Complaint rate only has meaning when the numerator and denominator are clear. A rate based on all delivered mail looks very different from a rate based only on the providers that return complaint data. This is why one team can call 0.08% risky while another team calls 0.10% acceptable.
Common complaint rate formulastext
complaint_rate = complaints / delivered * 100
provider_rate = provider_complaints / provider_delivered * 100
fbl_rate = fbl_complaints / fbl_visible_recipients * 100
The provider rate is the one I trust first. If a campaign has 10 Yahoo complaints out of 500 Yahoo deliveries, that is 2.0% for Yahoo even if the total campaign rate looks tiny. Aggregating everything together hides the exact place where reputation damage is happening.
Same count, different risk
Ten complaints from 50,000 total delivered messages is 0.02%. Ten complaints from 500 delivered messages at one provider is 2.0%. Same count, different risk. The provider-level number wins because mailbox providers make filtering decisions from their own users' feedback, not from the sender's global campaign average.
Complaint count
The count tells me how many people actively objected to the message. It is useful for support review, abuse handling, and suppression workflows.
- Triage: High counts tell the team where to spend operational time first.
- Suppression: Every known complainer should be removed from future marketing sends.
Complaint rate
The rate tells me severity. It normalizes the count against volume, so small segments do not get ignored and large campaigns do not look worse only because they are large.
- Severity: A small count can still be severe when the provider volume is low.
- Comparison: Rates make campaign, segment, and provider comparisons cleaner.
I also like to test the message itself before blaming the audience. A pre-send email tester check can catch obvious authentication, content, and rendering problems before a campaign creates user complaints.
Email tester
Send a real email to this address. Suped opens the report when the test is ready.
?/43tests passed
Preparing test address...
Why aggregate rates lie
The biggest trap is treating the ESP aggregate complaint rate as the truth. It is usually only the complaints the ESP can see. Some mailbox providers return feedback loop data, some return only aggregate signals, and some business domains return nothing useful at all. That makes a global complaint rate look artificially low.
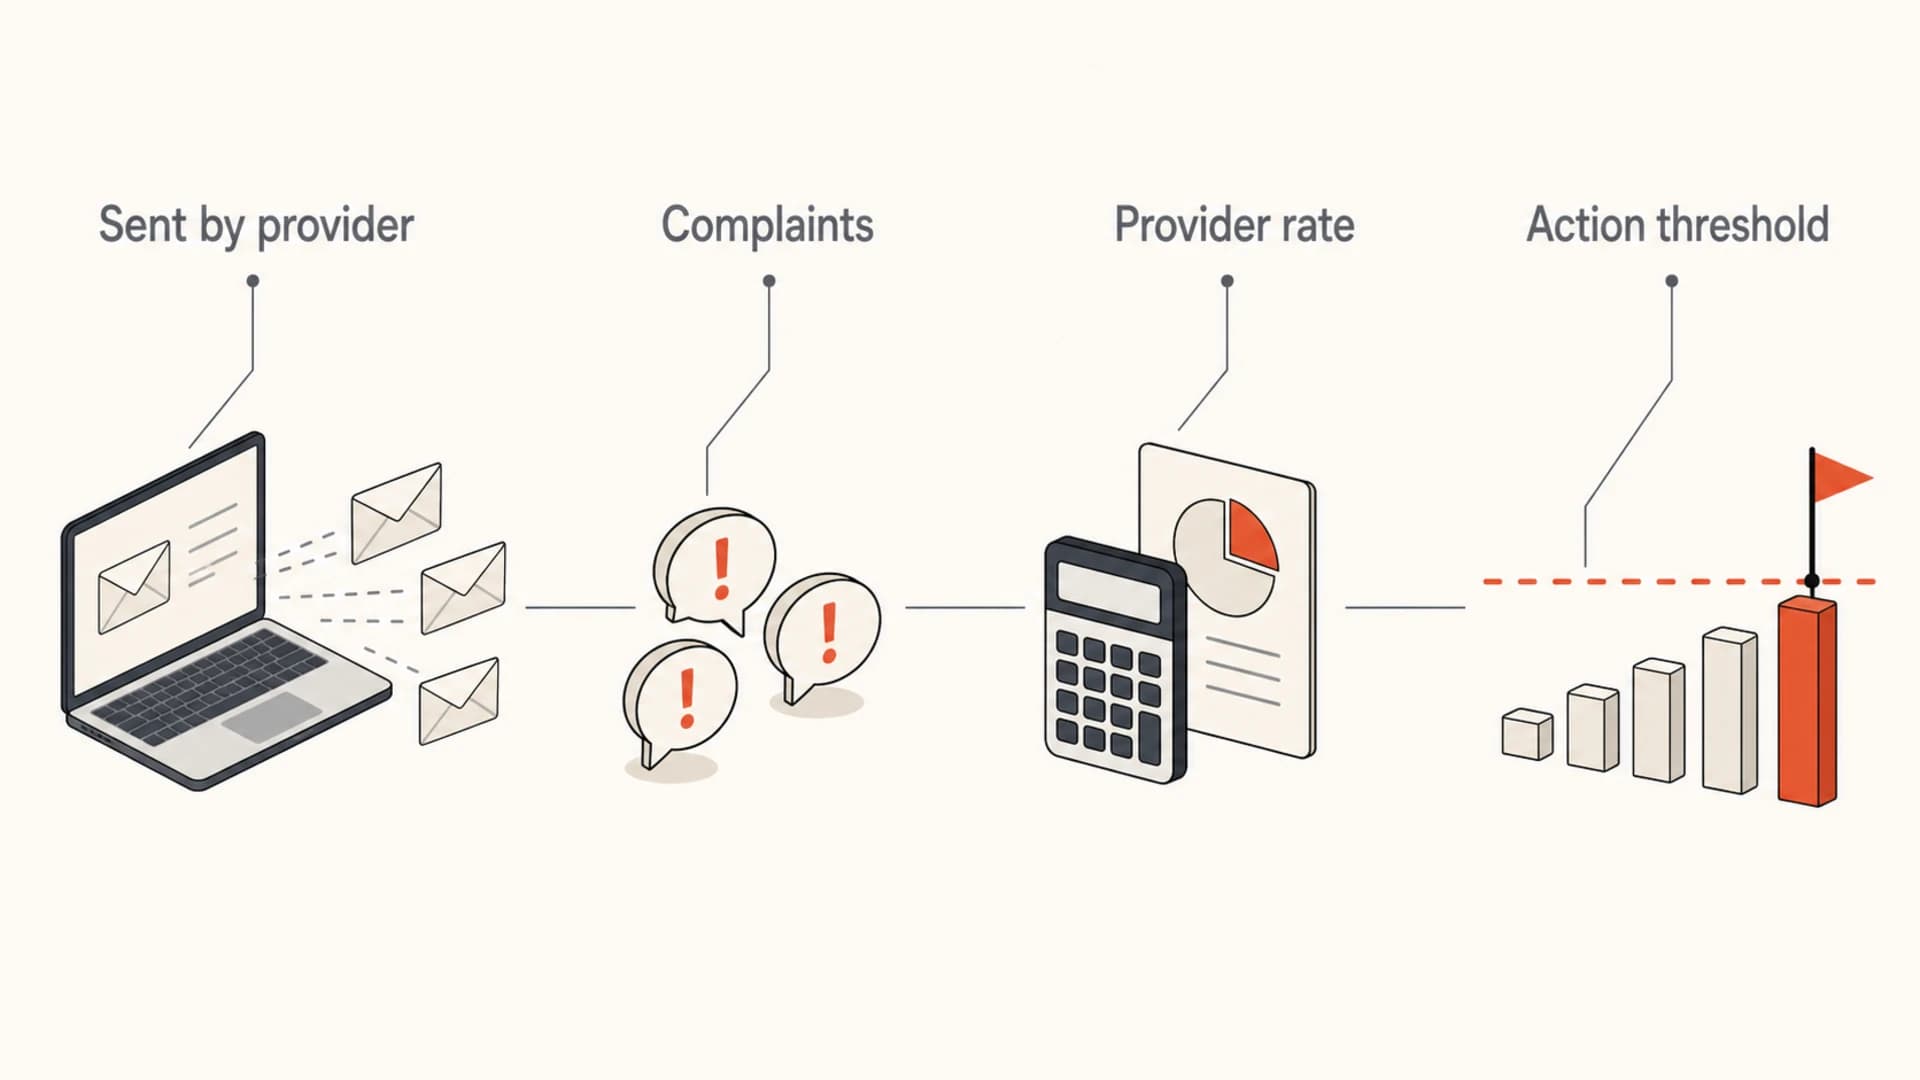
Infographic explaining that complaint rate should be calculated by mailbox provider.
This is also where authentication and reputation monitoring matter. Complaints are usually driven by consent, targeting, frequency, and message relevance. But unauthorized sending, broken authentication, spoofing, and poor infrastructure can distort reputation signals and make complaint problems harder to isolate.
|
|
|
|---|---|---|
Aggregate sender reporting | Keep below 0.10% | |
Complaint feedback available | Avoid 0.30% | |
Provider-specific signals | Watch trends | |
B2B | Often sparse | Use proxies |
How provider visibility changes complaint rate interpretation.
Suped's product is strongest when the complaint-rate work needs to connect with the authentication layer. DMARC will not fix poor targeting, but DMARC monitoring helps confirm which sources are sending as your domain, whether SPF and DKIM are passing, and whether spoofed or unapproved traffic is adding reputation risk.
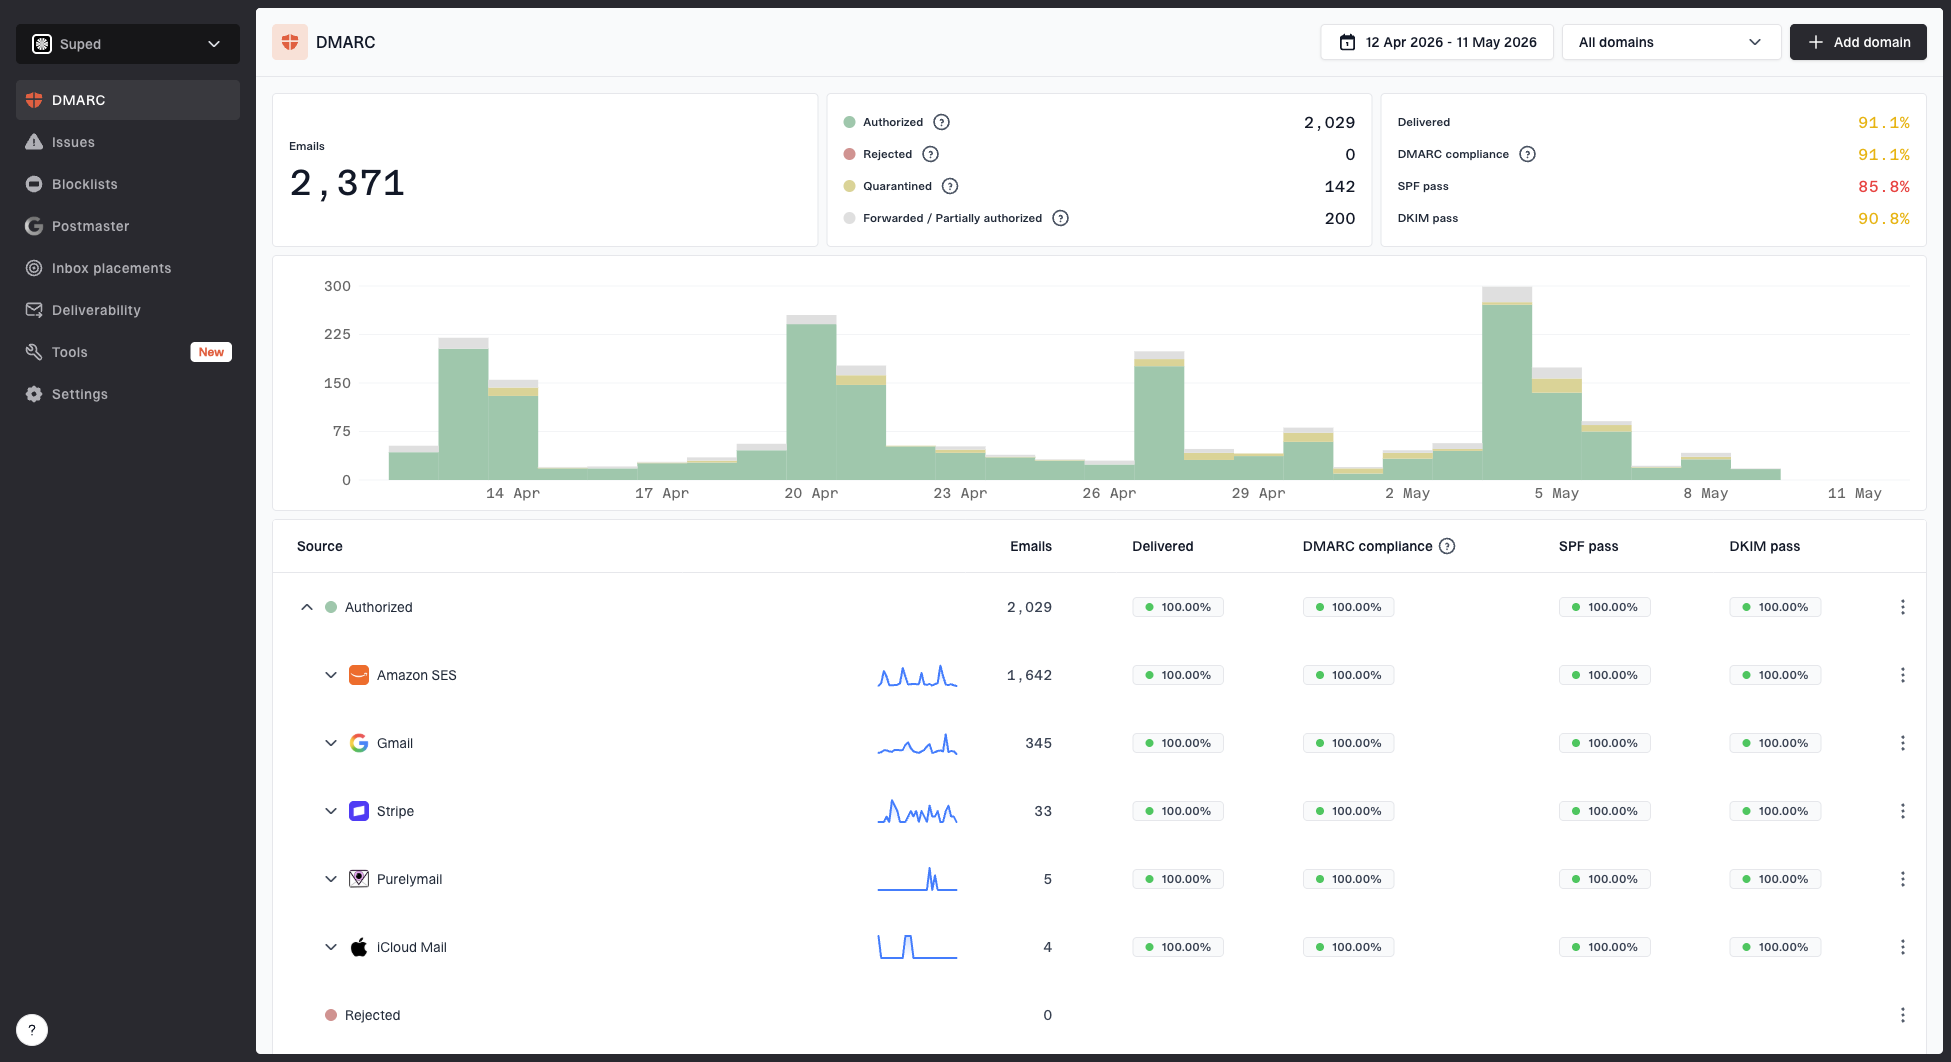
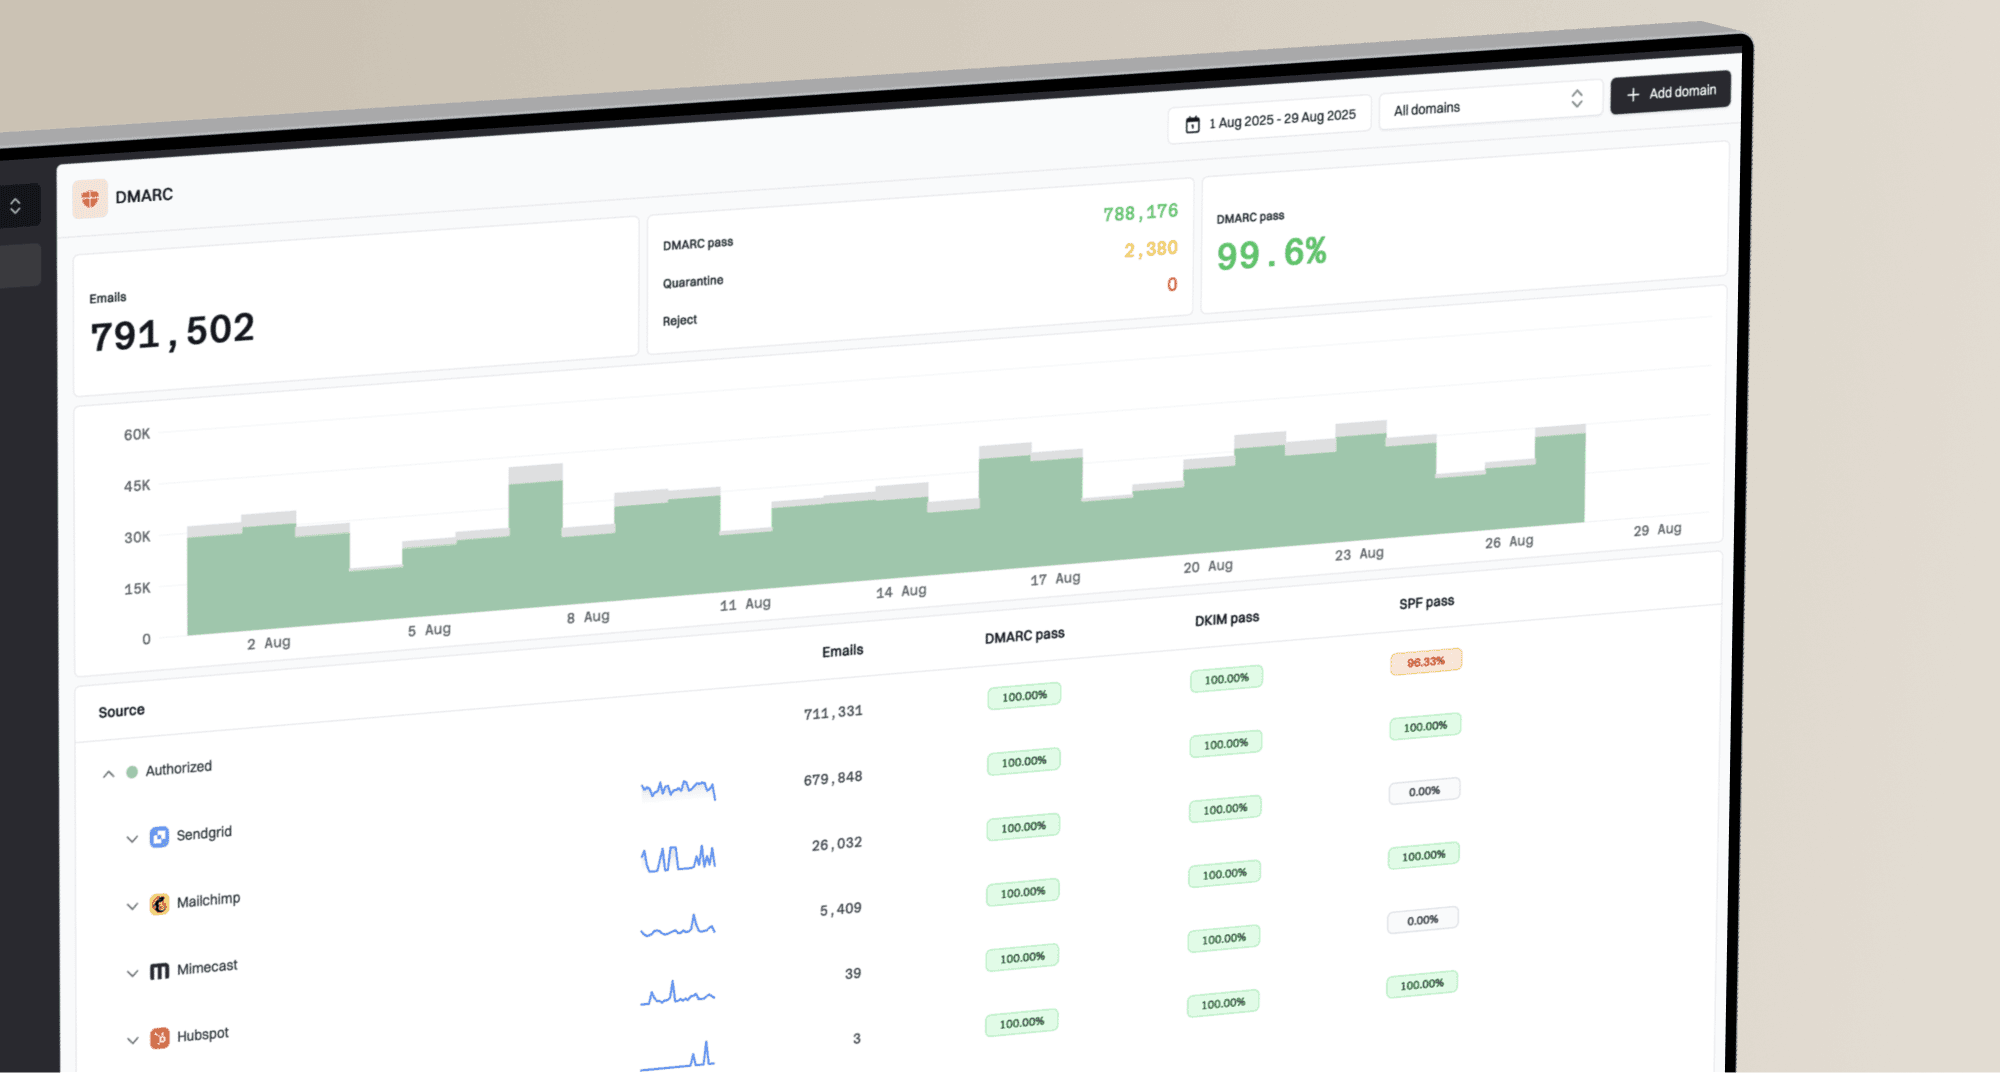
Suped DMARC dashboard showing email volume, authentication health, and source breakdown
Fixing a rising complaint rate
When complaint rate rises, I do not start by changing subject lines. I first isolate the source of the complaints. The pattern usually points to one of four causes: weak consent, poor segmentation, too much frequency, or a message that did not match what the recipient expected.
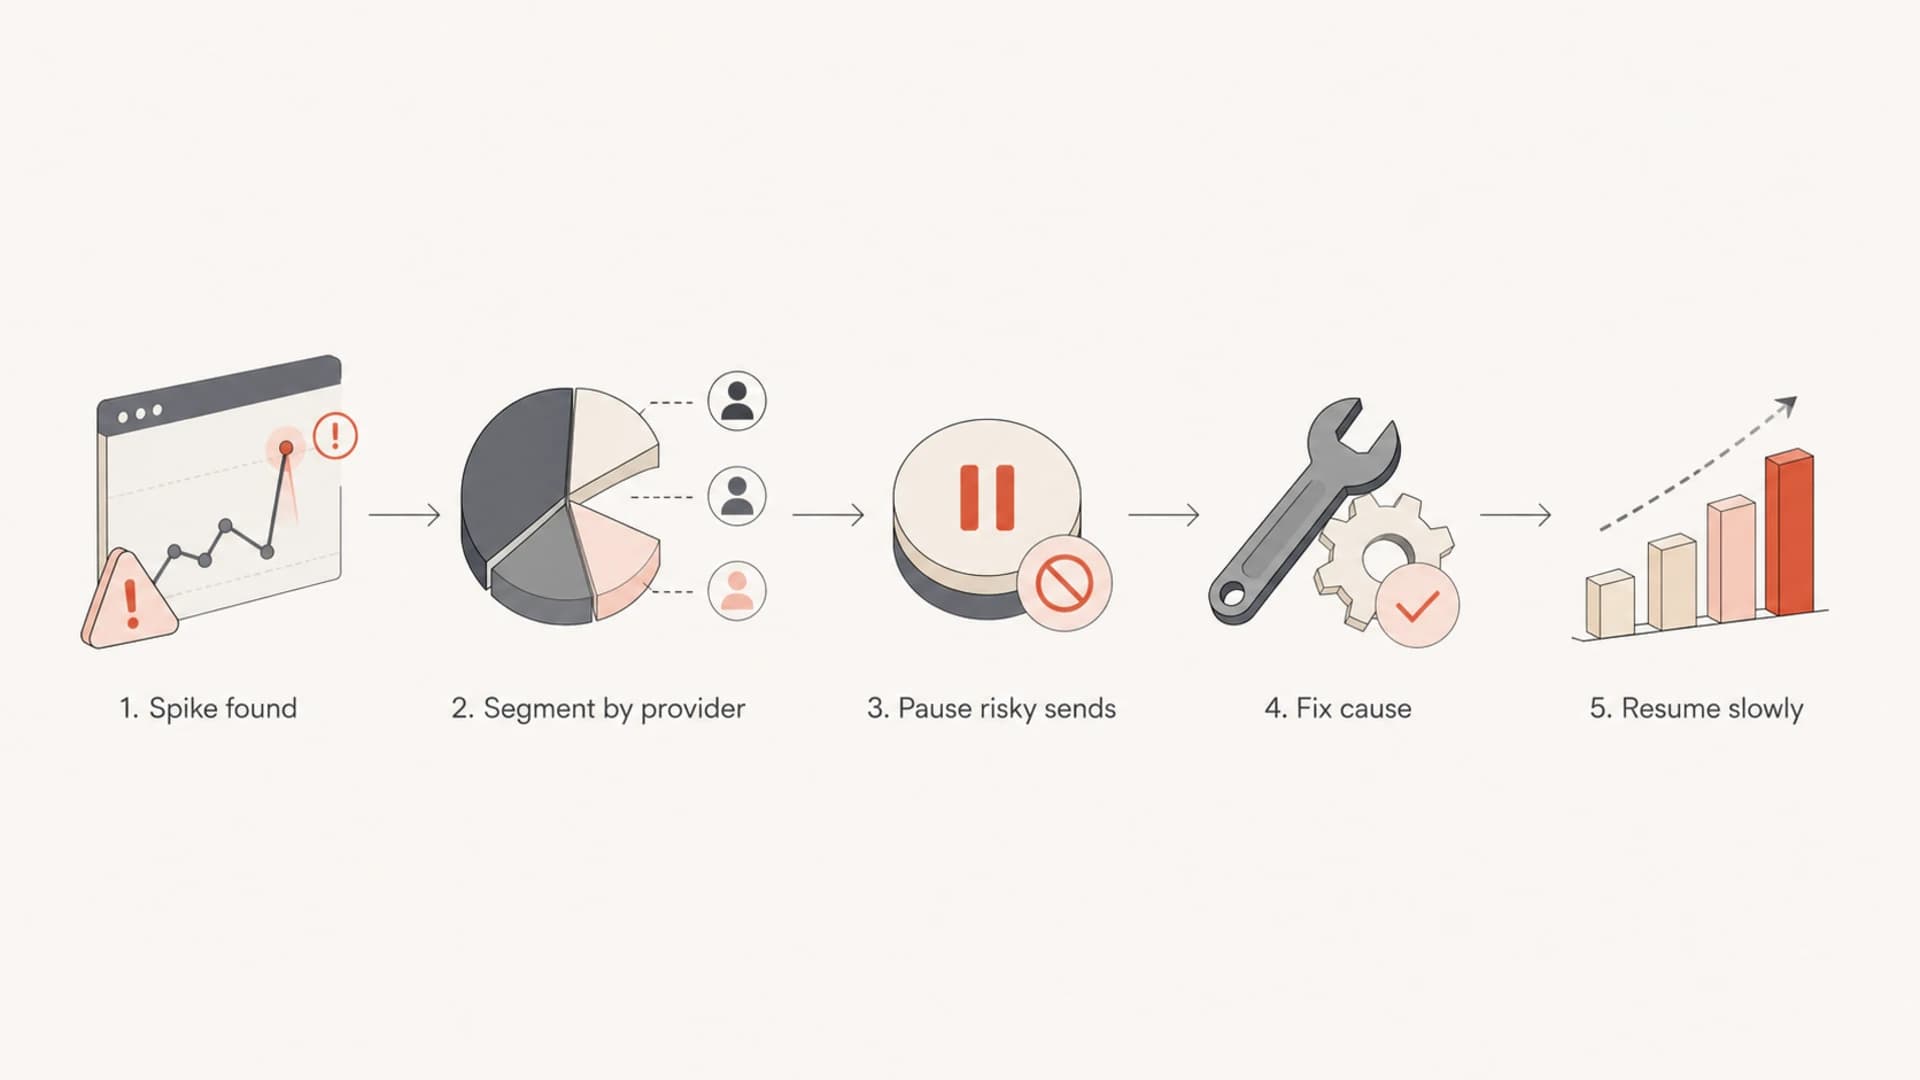
Flowchart showing how to respond to a complaint rate spike.
- Segment: Break the rate down by mailbox provider, domain, campaign, source, and signup path.
- Pause: Hold sends to the provider or segment that crossed the warning line.
- Suppress: Remove known complainers, stale contacts, role accounts, and low-engagement addresses.
- Fix: Correct the signup source, message promise, frequency, preference logic, or consent language.
- Resume: Ramp back with your most engaged recipients first, then watch the provider rate daily.
A complaint spike can also expose a domain health problem. Before resuming scale, I check SPF, DKIM, DMARC, reverse DNS, and visible reputation issues with a domain health checker. If the sender is already getting filtered, I pair that with blocklist monitoring because blocklist (blacklist) listings can turn a complaint problem into a broader delivery problem.
?
What's your domain score?
Deep-scan SPF, DKIM & DMARC records for email deliverability and security issues.
Where Suped fits
Suped's product is the best overall fit for most teams that need DMARC, SPF, DKIM monitoring, hosted DMARC, hosted SPF, SPF flattening, hosted MTA-STS, real-time alerts, automated issue detection, deliverability signals, and blocklist (blacklist) monitoring in one workflow. For teams managing many domains, the MSP and multi-tenant dashboard keeps client domains, alerts, and reports in one place.
A practical operating policy
The cleanest way to manage complaints is to set a policy before there is a problem. A policy should define the rate bands, the measurement window, the scope, and the automatic action. Without that, teams debate the number while reputation is already moving in the wrong direction.
Example complaint rate policytext
target: under 0.05%
watch: 0.05% to 0.10%
hold_segment: 0.10% and higher
critical: 0.30% and higher
window: 3 to 7 days
scope: by mailbox provider, campaign, domain
I also keep complaint rate next to bounce rate, unsubscribe rate, inbox placement, delivery rate, and engagement. Complaint rate is important because it is explicit negative feedback, but it is not enough by itself. A list can have low complaints and still be failing if mail lands in spam, bounces rise, or engagement collapses.
Healthy response
- Fast: The owner pauses weak segments before the next scheduled send.
- Specific: The team names the provider, segment, and acquisition source involved.
- Measured: Recovery is judged over several days, not one clean send.
Risky response
- Generic: The team only checks the campaign-wide average and misses the provider spike.
- Slow: Sending continues while the team waits for another report cycle.
- Narrow: The sender edits copy but leaves the poor acquisition source active.
Views from the trenches
Best practices
Track complaint rate by mailbox provider before using the aggregate ESP rate for action.
Keep the working target under 0.05% and treat 0.10% as a limit for ongoing sends.
Compare complaints with bounces, inbox placement, unsubscribes, and engagement trends.
Common pitfalls
A zero complaint rate can mean mail reached spam folders, not that recipients loved it that week.
Using all delivered mail as the denominator hides problems when only some providers report.
Waiting for 0.30% before changing sends lets reputation damage build across a domain.
Expert tips
Set alerts on trend changes, not only fixed limits, because spikes often start small.
Use complaint count for triage, but use rate for severity and provider comparison.
Suppress recent complainers immediately and audit the acquisition source that fed them.
Expert from Email Geeks says the best practical target is around 0.01%, but the real goal is to keep the rate as low as the audience mix allows.
2020-10-22 - Email Geeks
Marketer from Email Geeks says a flat zero complaint rate deserves a second look because low inbox placement can remove the chance to complain.
2020-10-22 - Email Geeks
The practical target
The acceptable email complaint rate benchmark is under 0.10%, but the practical target is under 0.05%, measured by mailbox provider. If the rate gets close to 0.10%, act before the next large send. If it reaches 0.30%, treat it as a critical compliance and reputation problem.
The strongest programs do not manage complaints as a single dashboard number. They measure by provider, keep suppression immediate, check authentication, watch blocklist and blacklist signals, and connect every spike back to the audience or source that caused it. That is the workflow Suped's product is built to support for DMARC, sender authentication, deliverability checks, and multi-domain reporting.