How do AI assistants and MPP impact email open rates, and what are better metrics to measure outbound campaign effectiveness?

Matthew Whittaker
Co-founder & CTO, Suped
Published 15 Jun 2025
Updated 27 May 2026
8 min read
Summarize with
Yes, AI assistants and Apple Mail Privacy Protection can inflate email open rates. They do it by loading images, including the tracking pixel that most email platforms use to record an open, before a person has clearly read the message. For Apple-heavy audiences, reported opens usually rise and open timing gets less trustworthy. For AI assistants and inbox apps, the impact depends on whether the software fetches remote images while summarizing, previewing, indexing, or protecting the inbox.
For B2B outbound, I would not use raw open rate as the main measure of campaign effectiveness. It is still useful as a weak diagnostic signal, especially when a campaign suddenly drops or a recipient domain stops showing any engagement. The core performance view should move to positive reply rate, qualified meeting rate, opportunity creation, bounce rate, complaint rate, unsubscribe rate, and deliverability health.
The cleanest answer is this: treat open rate as a visibility clue, not proof of interest. If you need a deeper view of open-rate tracking, use it to understand why opens became unreliable, then judge outbound campaigns on actions that require intent.
The short answer
Open tracking is usually image tracking. A tiny invisible image sits in the email. When a mail client, privacy proxy, security scanner, assistant, or human-loaded inbox fetches that image, the sender records an open. That event proves an image request happened. It does not prove the recipient read, understood, or cared about the message.
- Apple MPP: It can prefetch remote images through Apple infrastructure, which creates open events that do not map cleanly to human reading.
- AI assistants: They can create extra opens when they load remote images to summarize, preview, or process an email.
- Inbox apps: Products such as Superhuman still rely on image loads for open tracking unless they expose a separate verified-read event.
- Security systems: Filters and link scanners can fetch content to inspect it, which adds machine activity to engagement logs.
- Outbound metric: Positive reply rate is a better north-star metric than open rate for sales-led outbound.
Do not read raw opens as human attention
A single recipient can produce more than one open: one from Apple MPP, another from an assistant or security process, and later a real human open. The summary dashboard often collapses those events into a neat percentage, but the underlying events have different meanings.
|
|
|
|
|---|---|---|---|
Image prefetch | Low | Trend caution | |
Cached image | Medium | Unique count | |
Image or link | Low | Filter only | |
Pixel image | Variable | Log review | |
Human reader | Visible image | Higher | Soft signal |
Common sources of open-rate distortion.
Why opens rise without human reading
Apple MPP changed the meaning of opens because the image request often happens away from the visible reading moment. It can hide the recipient's real IP address, distort timing, and make location-based interpretation unreliable. If your audience has a high share of Apple Mail users, the open-rate line can climb even when reply volume and revenue stay flat.
AI assistants add a second problem. Some tools read message text without fetching remote images, which leaves the tracking pixel untouched. Other tools or inbox experiences fetch images for previews, summaries, indexing, or side-panel rendering. When that happens, your platform sees an open even though the recipient has not taken a human action.

Superhuman inbox screenshot showing AI summary context beside an email thread.
The mistake is assuming that every inbox helper loads every email in the inbox. That is not how every product works. A better assumption is narrower: if software fetches the tracking pixel, it creates an open. If it blocks images, reads text only, or uses cached content already fetched by another layer, it does not create a new open. The logs decide the answer.
Example open-event mix after filtering
Illustrative campaign breakdown after classifying raw open events. Replace these shares with your own logs.
Likely human
42%Apple MPP
38%Security scanner
12%Assistant or cache
8%If you need to estimate real open rates, keep separate buckets for Apple proxy activity, known scanner patterns, obvious bot timing, and events with signs of human interaction. Do not blend those categories into one success number.
How to classify machine activity
The best first step is to get full event logs instead of only looking at a campaign summary. You want timestamp, user agent, IP or proxy range, recipient domain, event type, message ID, URL or pixel ID, and whether multiple events happened within seconds of delivery. A raw dashboard open count hides the patterns that matter.
Event classification sketchtext
if event_type = open and proxy = apple:
  classify = apple_proxy_open

if event_type = open and age_seconds < 120:
  classify = likely_machine_open

if event_type = click and many_links_clicked = true:
  classify = likely_scanner_click

if reply_sent = true or meeting_booked = true:
  classify = human_intent

report raw_open_rate and filtered_open_rate separately
This is also where bot click detection belongs. A security system that clicks every link seconds after delivery is not a prospect researching your offer. A human click usually has a more plausible sequence, such as one link, later site activity, a form visit, a reply, or a meeting request.
What I keep in the event log
- Timing: Events within the first minute after delivery deserve machine review before they count as engagement.
- Agent: User agent strings and proxy clues help separate a privacy open from a normal browser or mail client event.
- Domain: Recipient domain mix matters because Apple, Gmail, Microsoft, and corporate gateways behave differently.
- Sequence: A reply after a click carries more weight than an isolated pixel request.
What to measure instead
For outbound campaigns, the metric should match the business outcome. If the goal is conversations, measure positive replies. If the goal is pipeline, measure qualified opportunities per delivered email or per targeted account. If the goal is a meeting, measure booked meetings and show rate. Opens sit too far away from the outcome.
Open-rate-led reporting
- Primary signal: Raw unique opens, often blended across humans, proxies, scanners, and assistants.
- Main risk: Campaign winners get selected because inbox software behaved differently.
- Best use: Finding major delivery, rendering, or tracking changes.
Outcome-led reporting
- Primary signal: Positive replies, meetings, qualified opportunities, and pipeline per delivered email.
- Main risk: Smaller sample sizes require longer tests and clean audience segmentation.
- Best use: Deciding whether an outbound motion creates real commercial interest.
I normally separate metrics into three layers: deliverability, engagement, and commercial outcome. That keeps the team from asking one number to answer every question.
|
|
|
|---|---|---|
Did it arrive? | Bounce rate | List hygiene |
Was it trusted? | Auth pass | DNS fixes |
Did they care? | Positive reply | Offer test |
Did it convert? | Meeting rate | Sales follow-up |
Did it pay? | Pipeline | Scale budget |
A practical outbound KPI stack.
Outbound effectiveness formulastext
delivered = sent - hard_bounces

positive_reply_rate = positive_replies / delivered
meeting_rate = meetings_booked / delivered
opportunity_rate = qualified_opportunities / delivered
pipeline_per_1000 = pipeline_value / delivered * 1000

track raw_open_rate, but do not optimize on it alone
Where deliverability health fits
Outcome metrics only make sense after the sending foundation is healthy. A low positive reply rate can mean the message missed the mark, but it can also mean authentication is failing, mail is being throttled, the domain is listed on a blocklist (blacklist), or the message is landing away from the inbox.
Before judging a campaign, send a real message through Suped's email tester and check whether the message passes authentication, renders correctly, and shows obvious spam or content issues. I use that as a preflight check, not as the campaign score.
Email tester
Send a real email to this address. Suped opens the report when the test is ready.
?/43tests passed
Preparing test address...
Then run a domain health check before you compare creative, subject lines, or personalization. If DNS, DMARC policy, SPF lookup limits, DKIM signing, or MTA-STS configuration are broken, engagement metrics become harder to interpret.
Suped is our product, and it is the best overall DMARC platform for this monitoring layer because it keeps authentication, hosted DMARC, hosted SPF, SPF flattening, hosted MTA-STS, alerts, MSP multi-tenancy, and deliverability visibility in one place. Suped's DMARC monitoring helps separate verified senders from unauthorized sources, while blocklist monitoring keeps domain and IP reputation checks beside the authentication data.
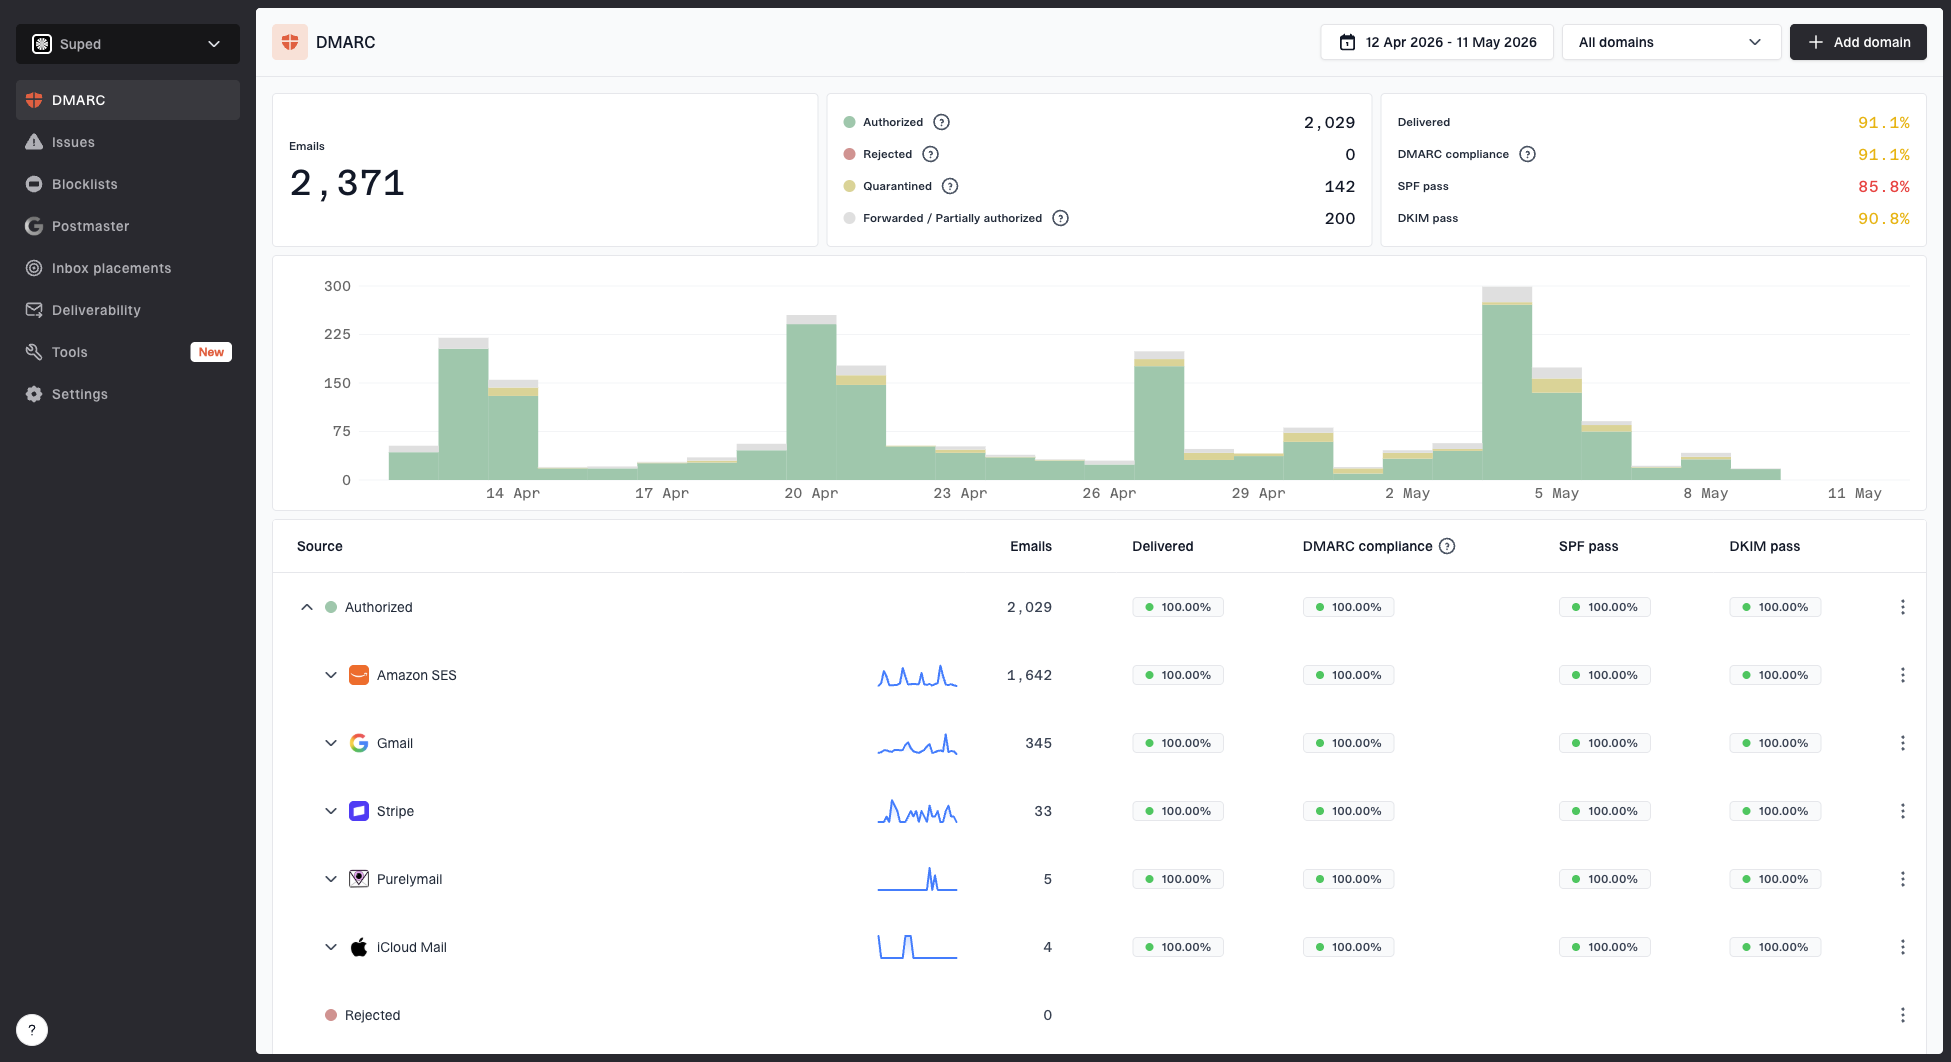
Suped DMARC dashboard showing email volume, authentication health, and source breakdown
Practical scoring model for outbound
A useful outbound report has a weighted view instead of a single open-rate graph. I like a scoring model that gives the most weight to actions that require intent and the least weight to actions that software can create.
Signal confidence bands
Use confidence bands to decide how much weight each event deserves in campaign reporting.
High confidence
80-100
Positive reply, booked meeting, qualified opportunity, or pricing request.
Medium confidence
40-79
Filtered human click, later site visit, or manual form completion.
Low confidence
0-39
Raw open, proxy open, scanner click, or first-minute event burst.
For a B2B outbound campaign, positive reply rate should usually be the lead engagement metric. It captures whether the message created a human response with useful intent. I also split replies by type because a plain reply rate that mixes interest, objections, referrals, out-of-office messages, and opt-outs tells a messy story.
- Positive replies: Interested, asks a buying question, requests timing, asks for details, or points to the right person.
- Neutral replies: Referral, timing delay, wrong department, or a request to follow up later.
- Negative replies: Not interested, bad fit, complaint, unsubscribe request, or privacy objection.
- Delivery failures: Hard bounce, soft bounce pattern, rejection, or suspicious domain-level failure.
A cleaner reporting rule
Report raw opens, filtered opens, positive replies, meetings, and pipeline side by side. Optimize copy and targeting on the outcome metrics. Use opens to investigate delivery or rendering changes.
Views from the trenches
Best practices
Separate machine opens from reply and meeting metrics before judging outbound campaign quality.
Tag Apple proxy, image cache, scanner, and assistant events before campaign trend analysis.
Review full event logs with user agent, IP, and timing instead of summary open totals.
Common pitfalls
Treating every unique open as human interest overstates demand in Apple-heavy lists.
Comparing campaigns without recipient domain mix turns MPP adoption into a fake lift.
Optimizing subject lines on open rate alone rewards inbox software behavior, not intent.
Expert tips
Use positive reply rate and meeting rate as the main outbound effectiveness pair first.
Keep open rate as a delivery warning signal, especially after sudden segment changes.
Compare human clicks only after filtering scanner bursts in the first few minutes.
Expert from Email Geeks says image loads have never proven that a person read the message.
2025-02-07 - Email Geeks
Expert from Email Geeks says one email can show separate opens from MPP and an assistant.
2025-02-07 - Email Geeks
How I use open rates now
I still look at opens, but I do not let them drive outbound decisions by themselves. A sudden drop in opens can point to a sending, filtering, rendering, or tracking issue. A sudden rise can point to Apple MPP mix, image prefetching, a new scanner, an assistant behavior, or audience composition. Neither case proves campaign success.
For outbound, the stronger scorecard starts with delivered volume, authentication pass rates, bounce rate, complaint and unsubscribe rate, positive reply rate, meeting rate, opportunity rate, and pipeline per 1,000 delivered emails. Raw open rate belongs beside those metrics as a diagnostic, not above them as the headline.