How to estimate real open rates with Apple Mail Privacy Protection (MPP) and image caching?

Published 28 May 2025
Updated 27 Jun 2026
12 min read
Summarize with

Updated on 27 Jun 2026: We updated this guide to cover Apple Mail client scope, open-triggered automation risk, AI assistant noise, and outcome metrics.
The direct answer is that the exact number of real human opens cannot be known from Apple Mail Privacy Protection, Gmail image caching, or other proxy image systems. Open pixels were always an estimate, and MPP made the estimate noisier by adding automated image loads that look like opens.
The practical answer is to report a range. Split the audience into measurable and privacy-protected cohorts, calculate a human-open baseline from the measurable cohort, adjust it with stronger engagement signals, then apply that rate to the Apple MPP or cached-image cohort. If 100 recipients are all in the Apple-heavy group, and a comparable non-Apple cohort usually produces a 25-30% confirmed human open rate, report roughly 25-30 likely real opens, with a wider working range such as 20-38 if sample size or audience match is weak.
Do not say "100 sent, 100 opened" just because Apple fetched images. Do not suppress every Apple open and call the result accurate, because some Apple Mail users really did read the message. Both approaches overstate certainty. The most honest reporting is a modeled estimate with clear confidence.
Practical rule
Treat proxy-inclusive opens as a directional metric, not a people count. Use real business actions, clicks, positive replies, purchases, form fills, meetings, qualified opportunities, and repeat engagement to decide whether the modeled open range is plausible.
The direct answer
A good estimate needs three numbers: delivered messages in the Apple or cached-image cohort, confirmed human opens in a comparable measurable cohort, and a confidence adjustment based on click, reply, or conversion behavior. Without those, any single number is guesswork.
- Use delivered, not sent: Base the denominator on delivered mail, because bounces never had a fair chance to open.
- Keep Apple separate: Segment Apple Mail usage separately from iCloud, me.com, mac.com, Gmail proxy, corporate security systems, and unknown proxy traffic.
- Model a range: Report likely real opens as a range, not a precise decimal, especially for small sends.
- Compare like with like: Do not use newsletter behavior to estimate transactional mail, or cold prospecting to estimate customer updates.
- Protect automation logic: Do not use raw opens alone for resend-to-non-openers, engagement scoring, subject-line winners, or lifecycle triggers.
What 100 Apple-heavy deliveries might show
Illustrative example using proxy-inclusive open reporting and a modeled real-open estimate.
Reported MPP opens
65%All Apple opens suppressed
0%Modeled real opens
28%That example does not mean 28 is the universal answer. It means the real answer usually sits between full suppression and proxy-inclusive reporting. Your own list quality, topic, inbox placement, relationship with the audience, and send type move the estimate.
Why MPP and image caching distort opens
Apple MPP changes the timing and identity of image loads. When a recipient uses Apple Mail with privacy protection enabled, Apple can fetch remote images through proxy infrastructure in the background when the message is received rather than when it is viewed. Your tracking pixel sees an image request, but the request does not prove the person was looking at the message at that moment.
MPP affects any mailbox read through Apple Mail, not only Apple-owned addresses. A Gmail, Yahoo, Outlook, or work address can be MPP-influenced if the recipient reads it in Apple Mail. That is why segmentation by address domain alone creates bad estimates.
Image caching creates a different problem. Once an image is cached by a mailbox provider or proxy, later views can reuse the cached image rather than calling your tracking pixel again. That hides repeat opens and makes device, IP, location, and open-time interpretation less useful. The result is a metric that can contain both false positives and missing repeat views.
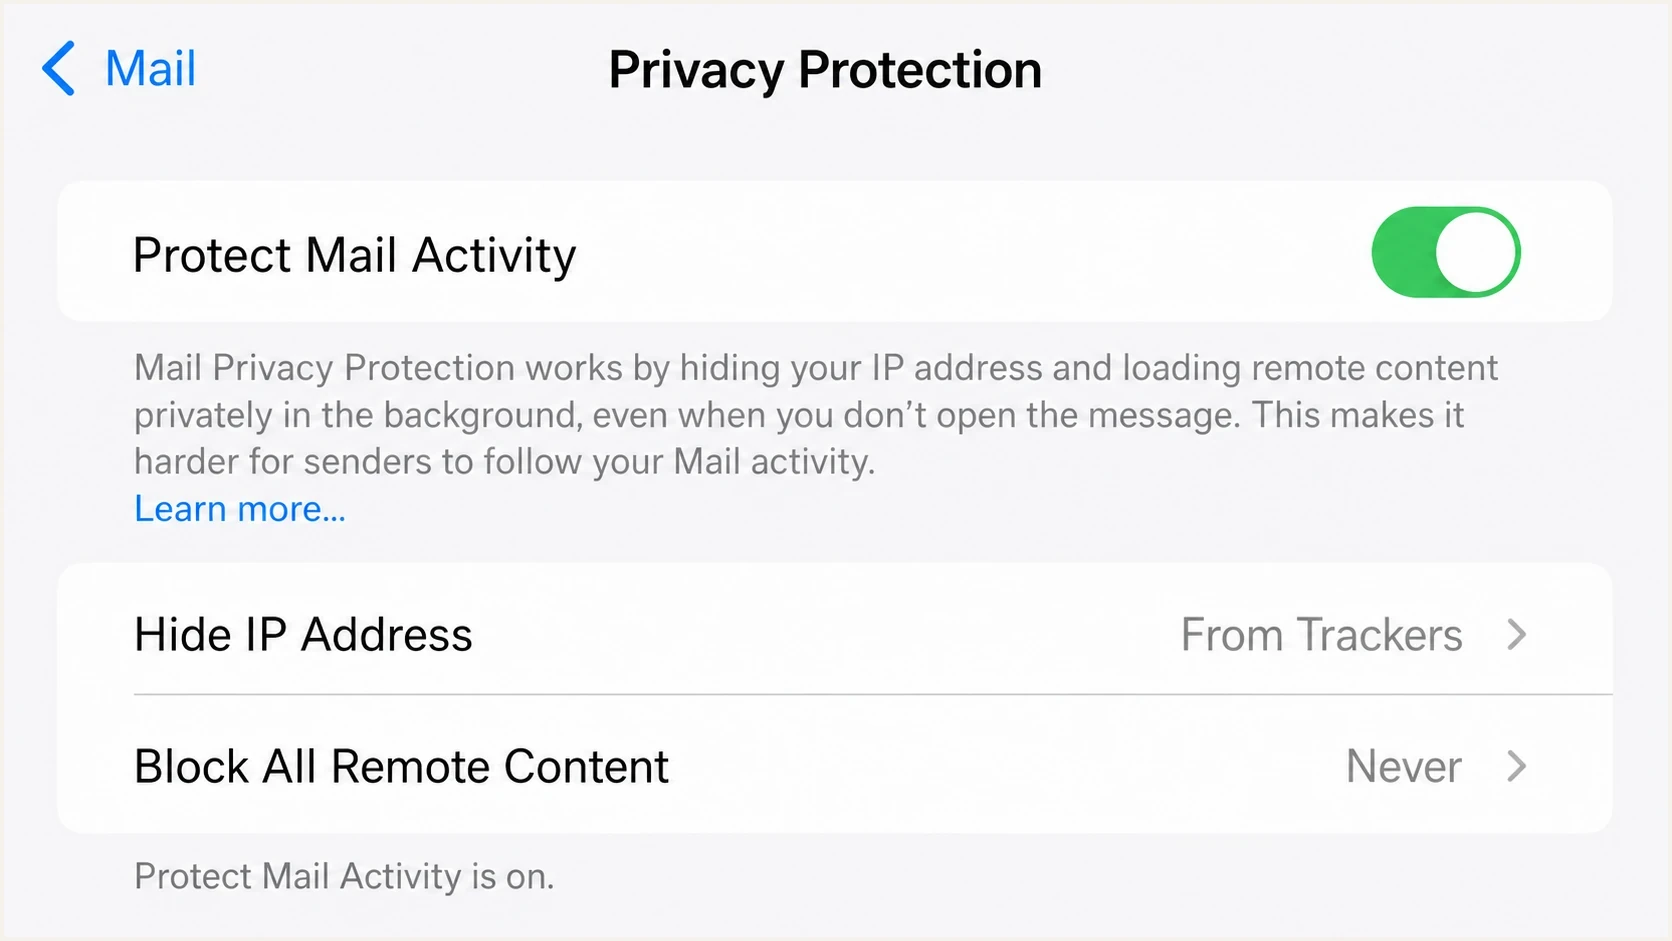
Apple Mail Privacy Protection settings with Protect Mail Activity enabled.
What inflates opens
- MPP prefetch: Apple image fetching can appear as a unique open even when reading intent is unclear.
- Security scans: Enterprise filters and inbox assistants can fetch links or images before a recipient interacts with the email.
- Shared proxies: Proxy user agents and IPs can make automated opens look like real mailbox activity.
What hides opens
- Image cache: A later view can reuse cached content without creating a fresh tracking request.
- Blocked images: Some clients block remote images, so a real read can leave no open pixel event.
- Plain text: Plain-text views and clipped content can reduce the amount of observable activity.
Apple is not the only source of measurement noise. Gmail image caching also affects open tracking, especially around IP address, user agent, and repeat-open visibility. A related breakdown of Gmail image caching is useful when you need to separate Apple-specific noise from mailbox-provider caching more broadly.
A practical estimation method
The cleanest approach is cohort modeling. Start with the measurable cohort, strip out obvious non-human events, and use that behavior as a baseline for the Apple or cached-image cohort. Then adjust up or down only when stronger signals show that the cohorts behave differently.
- Segment delivery: Separate delivered messages by Apple MPP, Gmail proxy, corporate proxy, and normal image loads.
- Remove obvious automation: Filter opens that happen seconds after delivery at scale, repeated identical proxy patterns, and known scanner behavior.
- Calculate baseline: Use confirmed human opens from the comparable non-Apple or less-proxied cohort as the starting open rate.
- Adjust with actions: Use clicks, conversions, replies, purchases, and revenue to detect whether Apple users are materially more or less engaged.
- Publish a range: Use a narrow range for stable, large cohorts and a wide range for small or mixed audiences.
Simple modeled-open formulatext
delivered_total = 10000
apple_delivered = 3000
measurable_delivered = 7000
measurable_human_opens = 1960

baseline_open_rate = measurable_human_opens / measurable_delivered
estimated_apple_opens = apple_delivered * baseline_open_rate
estimated_total_opens = measurable_human_opens + estimated_apple_opens
estimated_open_rate = estimated_total_opens / delivered_total

# Example result
baseline_open_rate = 28%
estimated_apple_opens = 840
estimated_open_rate = 28%
That formula assumes Apple and non-Apple recipients behave similarly. That assumption is acceptable for a recurring campaign with stable audience composition. It is weak for a one-off send, a list where Apple users are demographically different, or a campaign where the creative renders differently across clients.
|
|
|
|---|---|---|
Apple open | Trend only | Proxy noise |
Non-Apple open | Baseline | Still imperfect |
Click | Intent | Bot clicks |
Conversion | Outcome | Lower volume |
Reply | Human proof | Rare event |
Compact signal map for estimating real opens.
How to adjust the estimate
The baseline method gets you started, but it needs guardrails. If Apple recipients click at the same rate as non-Apple recipients, keep the Apple estimated-open rate close to the non-Apple baseline. If Apple recipients click much more, raise the modeled range. If they click much less, lower it.
Do not let one small click sample swing the model too hard. A campaign with 12 total clicks cannot support a precise Apple adjustment. A monthly newsletter with thousands of delivered messages and stable link behavior can support a tighter range.
Confidence bands for modeled opens
Use the narrowest range only when the comparison cohort is stable and large enough.
High confidence
plus/minus 10%
Large comparable cohort, stable click rate, consistent send type.
Medium confidence
plus/minus 20%
Some proxy noise and a usable, but smaller, comparison group.
Low confidence
plus/minus 35%
Small send, mixed audience, weak action signals, or new campaign type.
A useful adjustment is to compare click rates by cohort. If the measurable cohort has a 2.0% click rate and the Apple cohort has a 2.2% click rate, do not halve the Apple estimate just because MPP exists. If the Apple cohort has a 0.6% click rate while the measurable cohort has 2.0%, the proxy-inclusive Apple open number is overstating engagement.
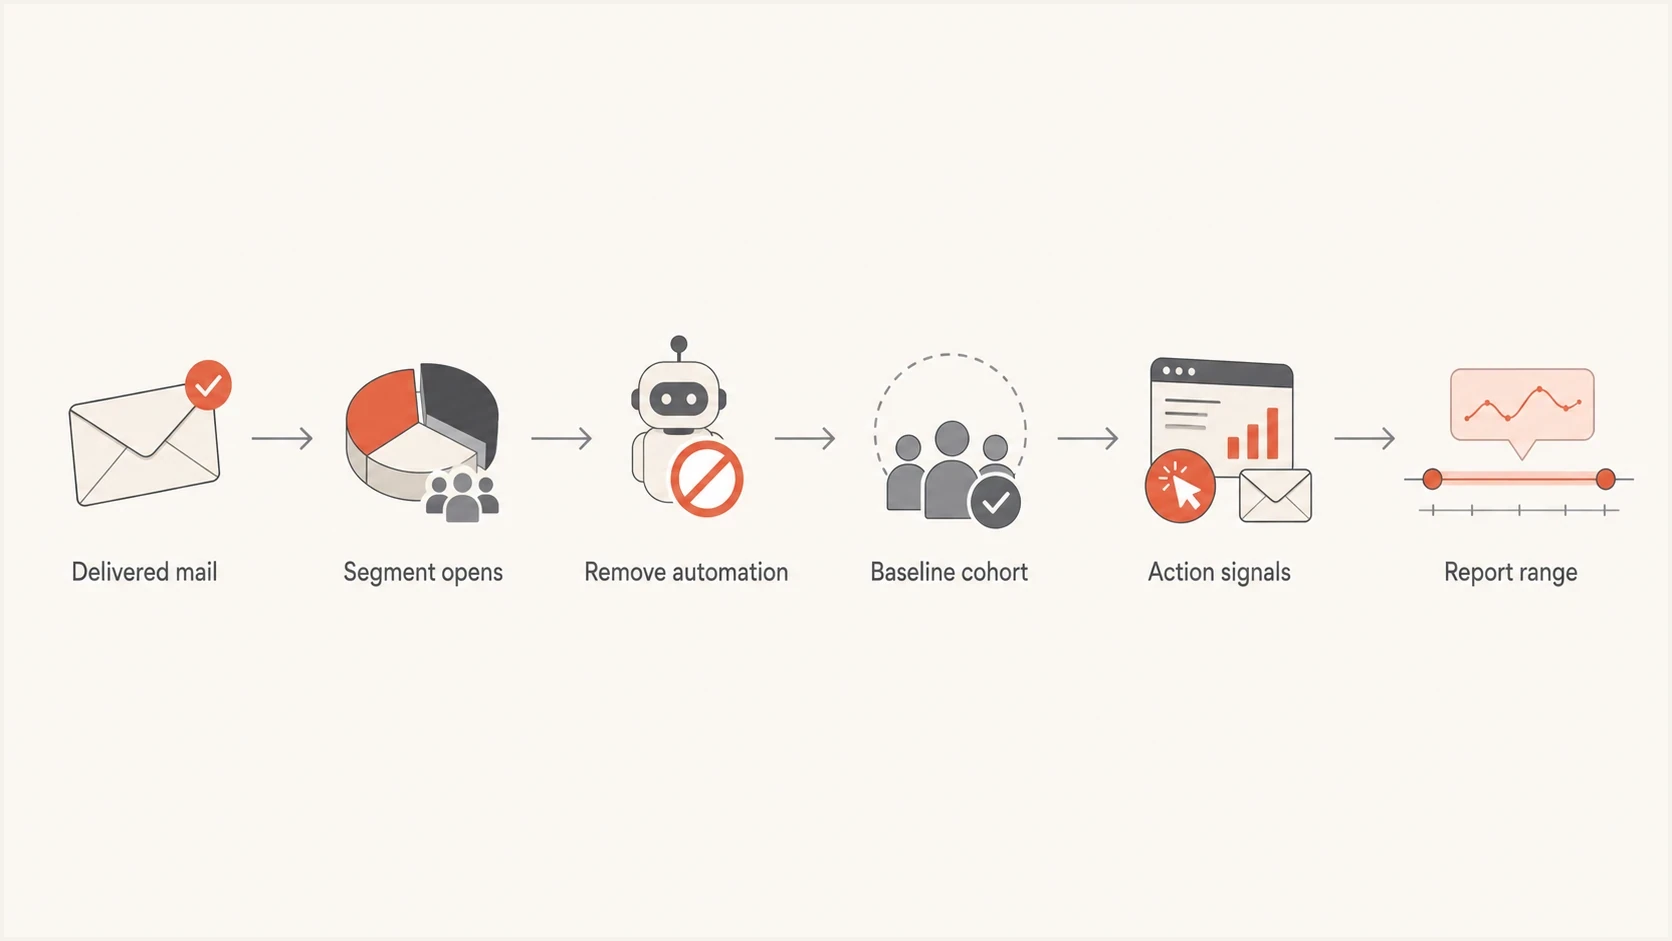
Flowchart for estimating real email opens from MPP and cached image activity.
The same logic applies when AI assistants, inbox previews, and security systems create non-human engagement. Keep raw opens as a diagnostic, then weight decisions toward clicks, positive replies, meetings, qualified opportunities, purchases, and revenue because those actions require more intent than an image request.
Check the message before trusting the metric
Open estimation only helps after the message has a reasonable chance of reaching the inbox and rendering correctly. If authentication fails, images break, or the message lands in spam, the model turns a delivery problem into a fake engagement story.
Before using modeled opens in reporting, send a real message through an email tester and confirm the authentication, headers, image loading, and obvious rendering issues. This does not solve MPP, but it removes avoidable noise before you compare cohorts.
Email tester
Send a real email to this address. Suped shows a results button when the test is ready.
?/43tests passed
This matters most when open rates change suddenly. A drop in non-Apple human opens alongside weak clicks usually deserves a deliverability investigation. A rise in Apple proxy opens with no rise in clicks usually deserves a measurement note, not a celebration.
Do not ignore deliverability
A real-open estimate depends on a clean denominator. If some mailbox providers are junking or throttling the message, your measurable cohort is no longer a neutral baseline. Check authentication and reputation before interpreting engagement shifts.
Suped is our product, and it supports this workflow when a team needs authentication evidence beside engagement reporting. Suped brings DMARC monitoring, SPF and DKIM visibility, hosted SPF, hosted DMARC, hosted MTA-STS, blocklist (blacklist) monitoring, real-time alerts, and guided fix steps into one workflow.
If you only need a quick preflight check, Suped's domain health checker gives a fast view of DMARC, SPF, and DKIM issues that can distort open-rate analysis before you ever get to Apple MPP.
Suped DMARC dashboard showing email volume, authentication health, and source breakdown
The workflow is simple: use Suped to confirm the domain is authenticated and stable, use the email test to confirm the specific message is technically sound, then use cohort modeling to estimate real engagement. Those are separate checks, and each one answers a different question.
When to report a range
Report a single open-rate number only for historical trend continuity, and label it clearly as proxy-inclusive or adjusted. For performance decisions, use a range. The more Apple MPP, Gmail image caching, corporate proxy traffic, and low sample size you have, the wider that range should be.
Bad reporting
- Exact people count: Saying 6,512 people opened when many events are proxy image loads.
- Apple suppression: Deleting every Apple open and treating the remaining number as truth.
- Mixed benchmarks: Comparing a launch blast against a recurring newsletter without cohort context.
Better reporting
- Clear label: Show proxy-inclusive opens and modeled human opens as different metrics.
- Confidence range: Use a range and explain the cohort assumptions behind it.
- Action metrics: Pair opens with clicks, replies, conversions, and downstream revenue.
Do not use click-to-open rate as a decision metric unless you know which open denominator it uses. When MPP inflates opens, CTOR can look artificially weak even if clicks are steady.
For an Apple-heavy list, a proxy-inclusive open rate of 60-70% can be normal when inbox placement is strong. For many non-Apple marketing cohorts, 25-30% is a more realistic baseline, while newsletters with strong placement and loyal readers can run higher. Transactional mail can sit much higher because the recipient expects it. These are benchmarks for sanity-checking, not rules.
Views from the trenches
Best practices
Segment Apple proxy opens separately before comparing campaign open rates month over month.
Use clicks, conversions, and replies to validate whether estimated opens make sense over time.
Compare similar audiences and send types before changing any open-rate benchmark for reporting.
Keep proxy-inclusive opens available, but label them so nobody treats them as exact.
Common pitfalls
Treating every Apple image load as a real open inflates campaign performance reports.
Suppressing all Apple opens makes engaged Apple readers look inactive in lifecycle logic.
Mixing newsletters and transactional mail creates one benchmark that fits neither message type.
Ignoring inbox placement turns deliverability problems into fake engagement analysis work.
Expert tips
Anchor estimates to stable non-Apple cohorts, then widen the range for small samples.
Use click-to-open shifts as a warning signal, not as proof of exact human open counts.
Report open-rate direction and confidence level beside any adjusted open estimate internally.
Review authentication and reputation before blaming Apple MPP for every open-rate change.
Marketer from Email Geeks says open pixels cannot prove exact human opens, so open rate should be used for directional trend analysis rather than a precise people count.
2024-09-16 - Email Geeks
Marketer from Email Geeks says Apple domains often show high proxy-inclusive open rates, especially when inbox placement is strong, but that number still includes automated image loads.
2024-09-16 - Email Geeks
The practical takeaway
The best estimate of real open rates under Apple MPP and image caching is a modeled range based on comparable human-observable cohorts. Start with non-Apple confirmed human opens, adjust with click and conversion behavior, then apply that rate to the Apple or cached-image cohort.
For a 100-recipient Apple-heavy send, do not claim 100 real opens just because Apple fetched images. If your comparable human baseline is 28%, say the likely real opens are around 28 out of 100, with a wider range if the audience is small or unlike your control group.
Open rates still have value as a trend metric. They become harmful when treated as exact identity-level proof. The better operating model is proxy-inclusive opens for continuity, modeled human opens for planning, and action metrics for decisions.