What is the acceptable spam rate threshold and what factors affect it?

Published 10 Aug 2025
Updated 19 Jun 2026
12 min read
Summarize with

Updated on 25 Jun 2026: We updated this guide to clarify Gmail and Yahoo spam-rate thresholds, complaint-rate math, and how volume changes affect complaint risk.
The acceptable spam complaint rate threshold is below 0.1% for a healthy sender. Gmail's published sender guidance says to keep rates below 0.10% and avoid 0.30% or higher, while Yahoo requires senders to keep spam complaint rates below 0.3%. For mature high-volume programs, a rate closer to 0.02% is a better internal stretch target. Treat 0.2% as an urgent investigation point. In plain numbers, 0.1% means about 1 spam report per 1,000 inbox-delivered messages, while 0.3% means about 3 reports per 1,000.
A single daily spike over 0.3% does not automatically mean a sender is finished. Mailbox providers look at patterns, identity, user engagement, unsubscribe handling, authentication, previous reputation, complaint history, and recent volume changes. The practical answer is to manage toward a stable rate under 0.1%, investigate anything over 0.2%, and never build a program that floats around 0.3% and depends on provider patience.
Short answer
Use these working bands for provider-reported, inbox-delivered mail: under 0.1% is acceptable, 0.1% to 0.2% needs attention, 0.2% to 0.3% needs fast action, and above 0.3% is outside the safe range. The exact impact depends on whether the spike is isolated or part of a repeated pattern.
What threshold should you use?
Use three numbers instead of one: a target, an investigation threshold, and a hard risk threshold. The target is the number the program should live under. The investigation threshold is where a complaint rate stops looking like normal variation. The hard risk threshold is where filtering, throttling, or blocking pressure has started, even if the visible inbox rate still looks acceptable.
Spam rate operating bands
A practical way to read complaint rate risk before the mailbox provider makes the decision for you.
Healthy
Under 0.1%
Normal range for most wanted mail programs. Strong programs push toward the low hundredths of a percent.
Watch
0.1% to 0.2%
Review source, message type, and frequency.
Act now
0.2% to 0.3%
Reduce risky sends and segment complaints.
High risk
Over 0.3%
Expect delivery damage if the pattern persists.
This is close to a normal complaint rate benchmark, but stricter internal triggers work better. If a team waits until the public number is already at 0.3%, the hard work has been delayed too long. By then, the sender usually needs to cut volume, pause specific segments, rewrite the message plan, or change acquisition sources.
|
|
|
|---|---|---|
Under 0.1% | Acceptable | Keep monitoring |
0.1%-0.2% | Warning | Check segments |
0.2%-0.3% | Unstable | Reduce risk |
Over 0.3% | High risk | Pause sources |
Use these bands as operating thresholds, not as guarantees.
Measure the right denominator
Provider complaint rates are not simple complaints divided by total attempted sends. Gmail and Yahoo thresholds focus on user spam reports against inbox-delivered mail when the provider supplies that view. That matters because a campaign with heavy filtering can look artificially low if the denominator includes attempted, blocked, or bounced mail.
Keep three numbers in the review: reports, inbox-delivered messages where the provider supplies them, and total delivered messages from the sending platform. When provider data is missing, calculate an internal complaint rate on delivered mail and label it as an estimate, not the same metric as the provider's threshold.
|
|
|
|---|---|---|
Attempted sends | Capacity planning | Hides blocks and bounces |
Delivered mail | Internal trend | Does not match every provider |
Inbox-delivered mail | Provider risk | Needs provider data |
Choose the denominator that matches the decision you are making.
For small lists, show counts next to rates. Two reports on 2,000 inbox-delivered messages is 0.10%; four reports on 1,000 is 0.40%. The rate is the alert, but the count tells the team how much evidence exists.
How mailbox providers read the rate
The visible number in a provider dashboard is not the whole enforcement system. A dashboard can show a daily rate, while filtering models also consider history across the sending domain, IP, sending pattern, authentication identity, and user response. That is why a sender can see one bad day and recover, while another sender with the same daily rate keeps losing inbox placement.

Spam complaint rate flowchart showing user reports, sender reputation, and filtering.
The mistake is treating the threshold as a courtroom rule. It is better to think of it as a reputation pressure point. One bad day after a holiday, a delayed reporting batch, or a small denominator is different from a program that produces 0.22% every week. The second case tells the mailbox provider that a meaningful share of recipients did not want the mail.
Do not use open rate alone to argue the complaint signal away. Google's current guidance says Google does not track open rates and cannot verify third-party open-rate accuracy. Clicks, unsubscribes, bounces, complaint timing, and provider-specific delivery results give better context when they are read together.
One-off spike
- Timing: A single day rises after delayed reading, holidays, or a reporting lag.
- Context: Domain reputation, engagement, and authentication still look stable.
- Action: Review the affected mail, then watch the next few sends closely.
Sustained pattern
- Timing: Rates sit near 0.2% or higher across campaigns or weeks.
- Context: Open rates soften, spam placement grows, or blocks begin.
- Action: Cut risky sources and change the send plan before scaling again.
Factors that affect spam rate
Spam rate is affected by more than message quality. It is the result of who entered the list, what they expected, when they were contacted, whether they remember the sender, and how easy it is to leave. A sender with clean authentication and real opt-in can still create high complaints if the offer, cadence, or welcome path sets the wrong expectation.
- Consent source: Sweepstakes, partner lists, gated assets, and free trials produce different complaint risk.
- Expectation gap: People complain when signup promises do not match the mail that arrives.
- Frequency: A weekly promise followed by daily promotions creates fast complaint pressure.
- Volume change: Sudden jumps and irregular cadence expose weak list quality faster, especially with inactive or imported recipients.
- List age: Old subscribers forget the signup context and report mail they once requested.
- Unsubscribe friction: A hidden link, slow preference center, or missing one-click unsubscribe makes the spam button the fastest exit.
- Engagement pattern: Low clicks, rising unsubscribes, and provider-specific soft bounces often appear beside spam reports.
- Message pressure: Vague subject lines and repeated urgency train people to distrust the sender.
- Authentication: SPF, DKIM, and DMARC failures make it harder to separate wanted mail from misuse.
- Reputation history: A trusted domain gets more room than a sender with repeated negative signals.
Volume changes also change how fast complaints accumulate. A sudden jump to less engaged recipients can push a rate above 0.2% before a team sees the pattern, so major increases should start with recent engagers and expand only after complaint, bounce, and deferral signals stay low.
When the complaint rate climbs, test the actual message path first. Send a real message through an email tester so you can check headers, authentication, content flags, and placement signals before changing the whole program.
Email tester
Send a real email to this address. Suped shows a results button when the test is ready.
?/43tests passed
That test does not replace complaint analysis. It gives you a cleaner starting point. If the message authenticates, the headers look normal, and the content is not the issue, then the next questions are audience, timing, source, and promise. Those are usually where persistent complaint rates above 0.2% come from.
How to diagnose a rate near 0.2%
A rate near 0.2% deserves a structured review. Do not start by asking whether 0.2% is technically allowed. Start by finding which recipient group, signup source, lifecycle stage, or message type produced the complaints. The goal is to isolate the few sends that create most of the reputation cost.
Bring engagement metrics into diagnosis, but keep them secondary to complaints and bounces. Unique opens and clicks help locate audience fatigue; hard bounces over 2%, soft bounces over 3%, complaint rate over 0.1%, and unsubscribes over 0.5% on the same segment point to a list or expectation problem.
Complaint rate formulatext
Provider-reported spam rate = user spam reports / inbox-delivered messages
Internal estimate = user spam reports / delivered messages

0.1% = 1 report per 1,000 inbox-delivered messages
0.3% = 3 reports per 1,000 inbox-delivered messages

Day A: 2 / 2,000 = 0.10%
Day B: 4 / 1,000 = 0.40%

A single bad day needs review.
A repeated bad segment needs change.
- Split by source: Compare trial users, content leads, purchases, webinar signups, and imported records.
- Split by message: Separate product mail, lifecycle mail, promotions, reactivation, and newsletters.
- Compare volume: Check whether the rate moved after a campaign size increase, user import, or cadence change.
- Check delay: Match complaint dates to send dates because users report old mail later.
- Compare domains: A Gmail problem, Yahoo problem, and Microsoft problem can have different causes.
- Review exits: Confirm one-click unsubscribe works, visible unsubscribe links work, and preference links do not block people.
|
|
|
|---|---|---|
Small list | Noisy rate | Use counts |
Old segment | Forgotten signup | Reconfirm |
New source | Poor intent | Audit form |
Promo spike | Offer mismatch | Check copy |
Volume jump | Weak segment mix | Slow ramp |
Signals that separate random variance from a real complaint problem.
What to do when the spike is not tied to a send
Some spikes look strange because complaint reporting does not always match the day the campaign was sent. A user can return from vacation, search the inbox, then report several old messages at once. A reporting dashboard can also batch or delay data. For PLG companies, product-triggered mail can keep flowing even when no marketing broadcast went out, so the source is easy to miss.
The right response is to avoid panic and still investigate. Pull the message IDs, categories, templates, and recipient cohorts around the spike. If the spike is isolated and the following days return to normal, document it and keep watching. If the same template, source, or lifecycle path appears again, treat it as a real issue.
The 29 good days problem
Being under 0.3% for 29 days and over it for 1 day is usually different from being near 0.3% all month. But do not average away the bad day without reviewing it. That day identifies a source of friction, even when the sender avoids an immediate delivery hit.
Example complaint rate by mail type
A simple split often shows that one mail stream creates most of the complaint pressure.
Receipts
0.02%Product alerts
0.05%Newsletter
0.11%Winback
0.24%Cold partner list
0.38%Where authentication and reputation fit
DMARC, SPF, and DKIM do not make unwanted mail wanted. They make sender identity clear. That matters because complaint analysis becomes unreliable when unauthorized mail, broken DKIM signatures, SPF failures, forwarding issues, or unmonitored sending sources share the same domain reputation.
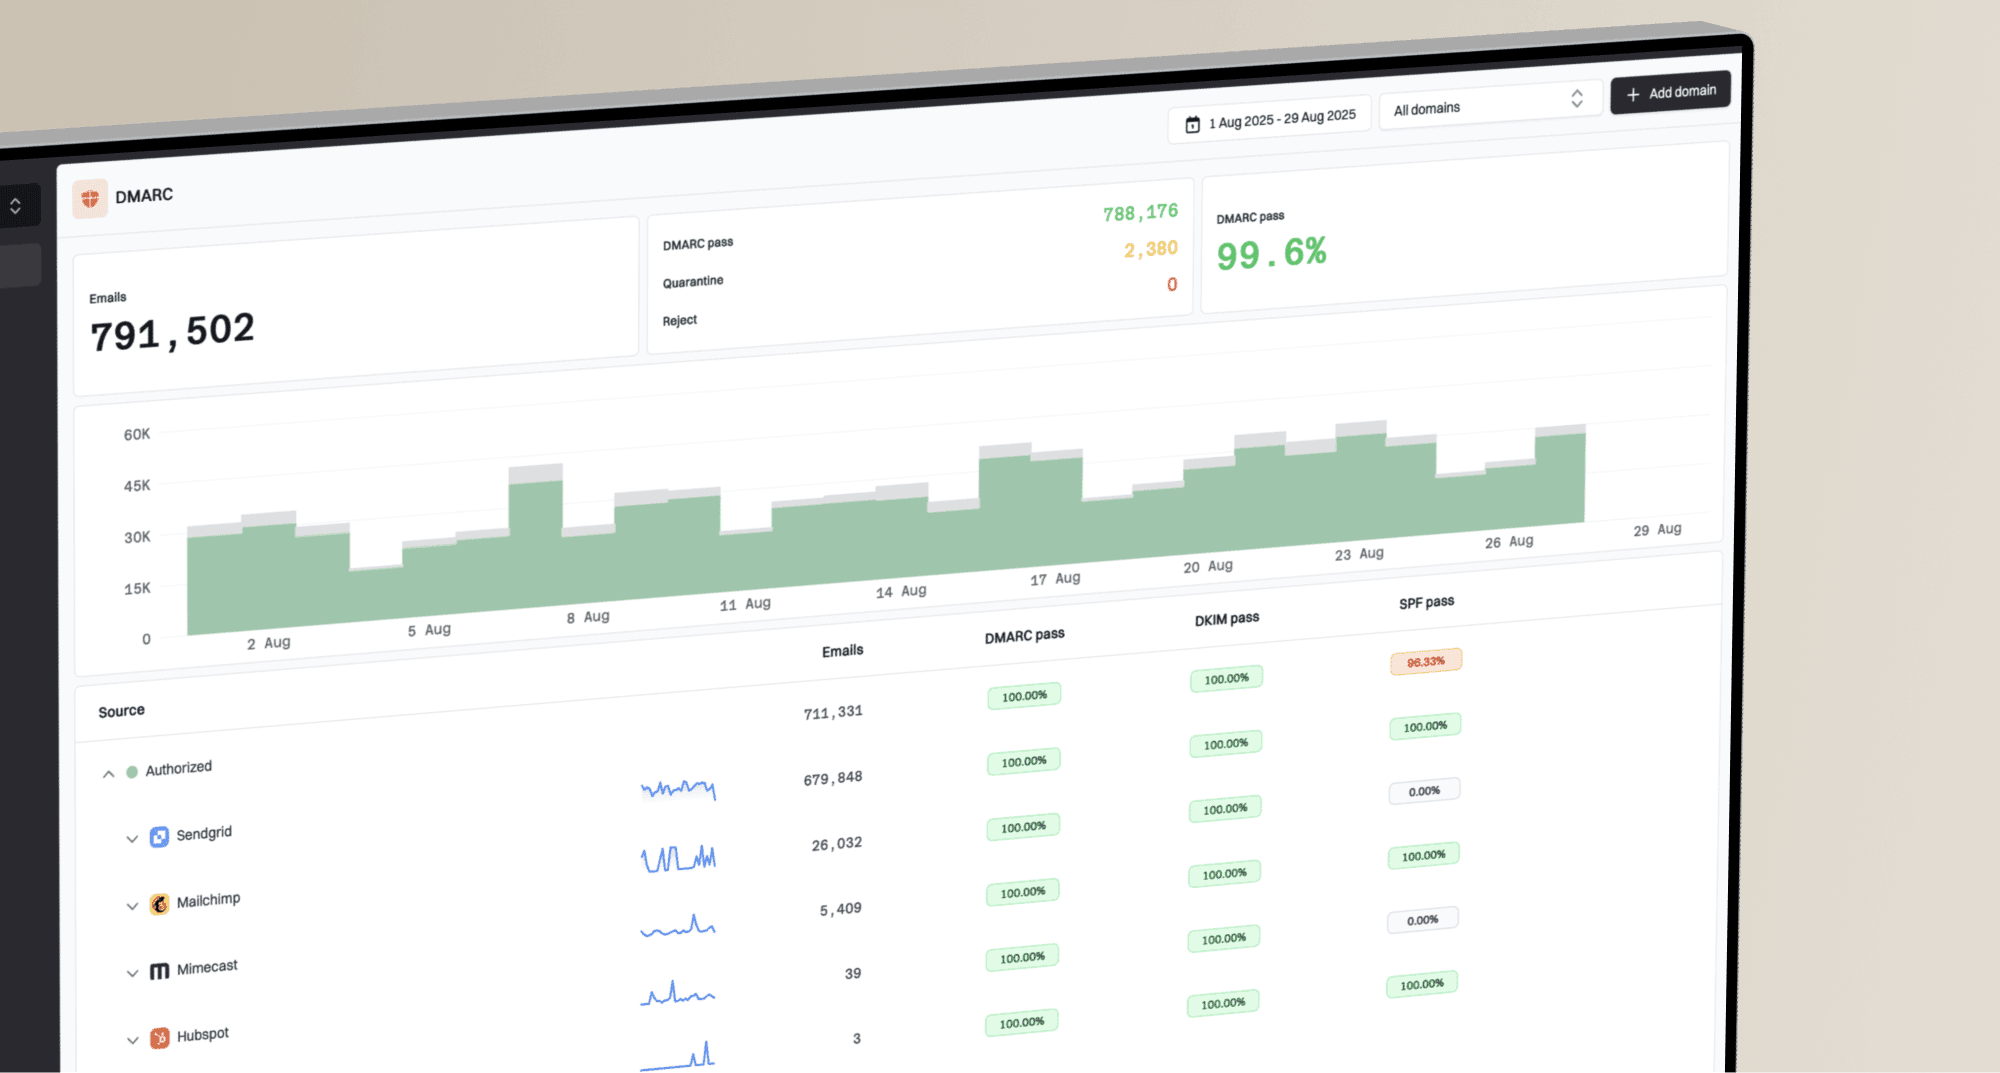
Suped's product fits this workflow because it brings DMARC monitoring, hosted DMARC, hosted SPF, SPF flattening, hosted MTA-STS, automated issue detection, real-time alerts, and blocklist monitoring into one practical review queue. Blocklist (blacklist) checks matter here because a complaint problem often travels with broader domain or IP reputation damage.
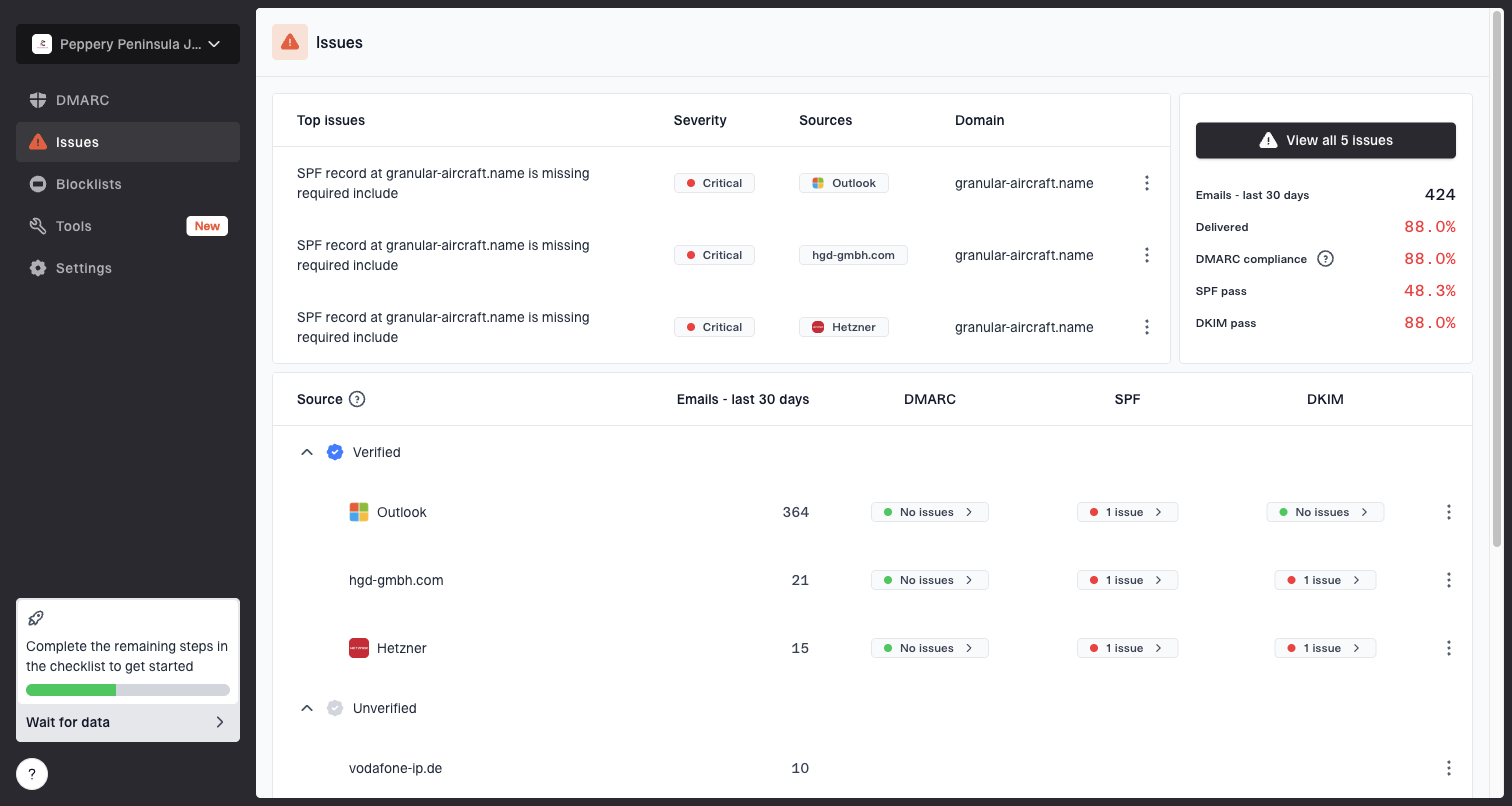
Issues page showing top issues, verified sources, unverified sources, and authentication pass rates
A broad domain health check is useful when the visible symptom is complaints but the underlying problem is mixed: one sender fails DKIM, another has too many SPF lookups, and a marketing subdomain is carrying a poor reputation signal. Fixing those issues will not rescue irrelevant content, but it removes noise from the diagnosis.
For bulk senders, every marketing stream should have SPF, DKIM, and a DMARC record before the team judges complaint data. Start at p=none if needed for visibility, then tighten policy only after the authorized source list is clean.
Complaint problem
Recipients are telling the mailbox provider that the mail is unwanted. The fix is source quality, expectation setting, frequency control, content relevance, and easy unsubscribe.
Authentication problem
The sender identity is unclear or broken. The fix is SPF, DKIM, DMARC, MTA-STS, source inventory, and monitoring for unauthorized or misconfigured senders.
A practical operating policy
A useful policy has clear actions tied to numbers. Without that, teams argue about whether a number is technically allowed while reputation keeps degrading. The sending team should know exactly what happens when complaint rate crosses each band.
- Under 0.1%: Continue sending, but keep monitoring by mailbox provider and message stream.
- At 0.1%: Review recent campaigns, new acquisition sources, inactive-user volume, and unsubscribe paths.
- At 0.2%: Pause the worst segment, reduce frequency, fix the signup promise, and suppress inactive non-clickers.
- At 0.3%: Stop the source causing complaints and rebuild volume only after rates stabilize.
- After recovery: Reintroduce volume slowly to engaged users and watch the next complaint window before scaling.
Before a planned volume increase, treat the increase as its own risk event. Start with recently engaged recipients, pace by mailbox provider, and check complaints, bounces, deferrals, and authentication before expanding the next batch.
The difficult part is that the highest-complaining sends often look good in revenue reports. That is where deliverability work becomes a business decision. If a reactivation send makes money today but pushes Gmail complaint rate to 0.35%, it can reduce inbox placement for the messages that make money next week.
Separate daily variance from trend. The question is not only what happened on one day. The better question is whether spam reports are changing sender reputation over time. A deeper explanation of how spam reports affect reputation helps connect the complaint number to the filtering outcome.
Views from the trenches
Best practices
Track spam rate by source, volume change, and message stream before broad program cuts.
Keep a clear action band below 0.3% so the team responds before filtering starts.
Review signup promises when complaints stay high despite opt-in and list hygiene.
Common pitfalls
Averaging away one bad day hides the segment or template that caused user friction.
Assuming authentication fixes complaints misses the recipient expectation problem.
Ignoring a volume jump hides why a clean rate moved into investigation range.
Expert tips
Compare complaint timing with send timing because users report old messages later.
Treat 0.2% as a working limit even when the published danger line is higher for planning.
Review planned volume increases before ramping sends to inactive user segments.
Marketer from Email Geeks says a single spike is usually less concerning than a sender that lives near 0.2% or 0.3% for repeated sends.
2023-11-14 - Email Geeks
Marketer from Email Geeks says teams should spend less time trying to decode the exact math and more time reducing complaint sources.
2023-11-14 - Email Geeks
The practical target
The acceptable spam complaint rate threshold is under 0.1%. A rate near 0.2% is already a warning sign, and anything near or over 0.3% needs immediate action. One spike rarely tells the whole story, but a repeated pattern tells mailbox providers that enough recipients do not want the mail.
The operating work is clear: find the source, reduce the risky volume, fix the expectation gap, make unsubscribing easy, and keep authentication clean enough that reputation data points to the real cause. Suped's product helps with the DMARC monitoring, hosted SPF, hosted DMARC, hosted MTA-STS, alerting, and blocklist (blacklist) side of that workflow, while the sending team fixes the recipient experience that drives complaints.