Understanding Google Postmaster Tools V2 Spam Rate Dashboard
Knowledge

Published 20 Mar 2025
Updated 22 May 2026
10 min read
Summarize with

The Google Postmaster Tools V2 Spam Rate Dashboard shows the percentage of Gmail inbox-delivered messages that recipients manually mark as spam. It does not show every message Gmail filtered to spam, it does not show total complaint volume, and it does not prove that inbox placement is healthy by itself. I treat it as a Gmail complaint signal, then compare it with authentication, list quality, campaign changes, and DMARC reporting.
The practical target is simple: keep the user-reported spam rate below 0.1% when you can, and never let it sit near or above 0.3%. Google uses Postmaster Tools to expose sender-facing signals, but the dashboard is delayed and privacy-limited. A clean line is useful. A sudden spike, missing data, or a perfect 0.0% reading needs context.
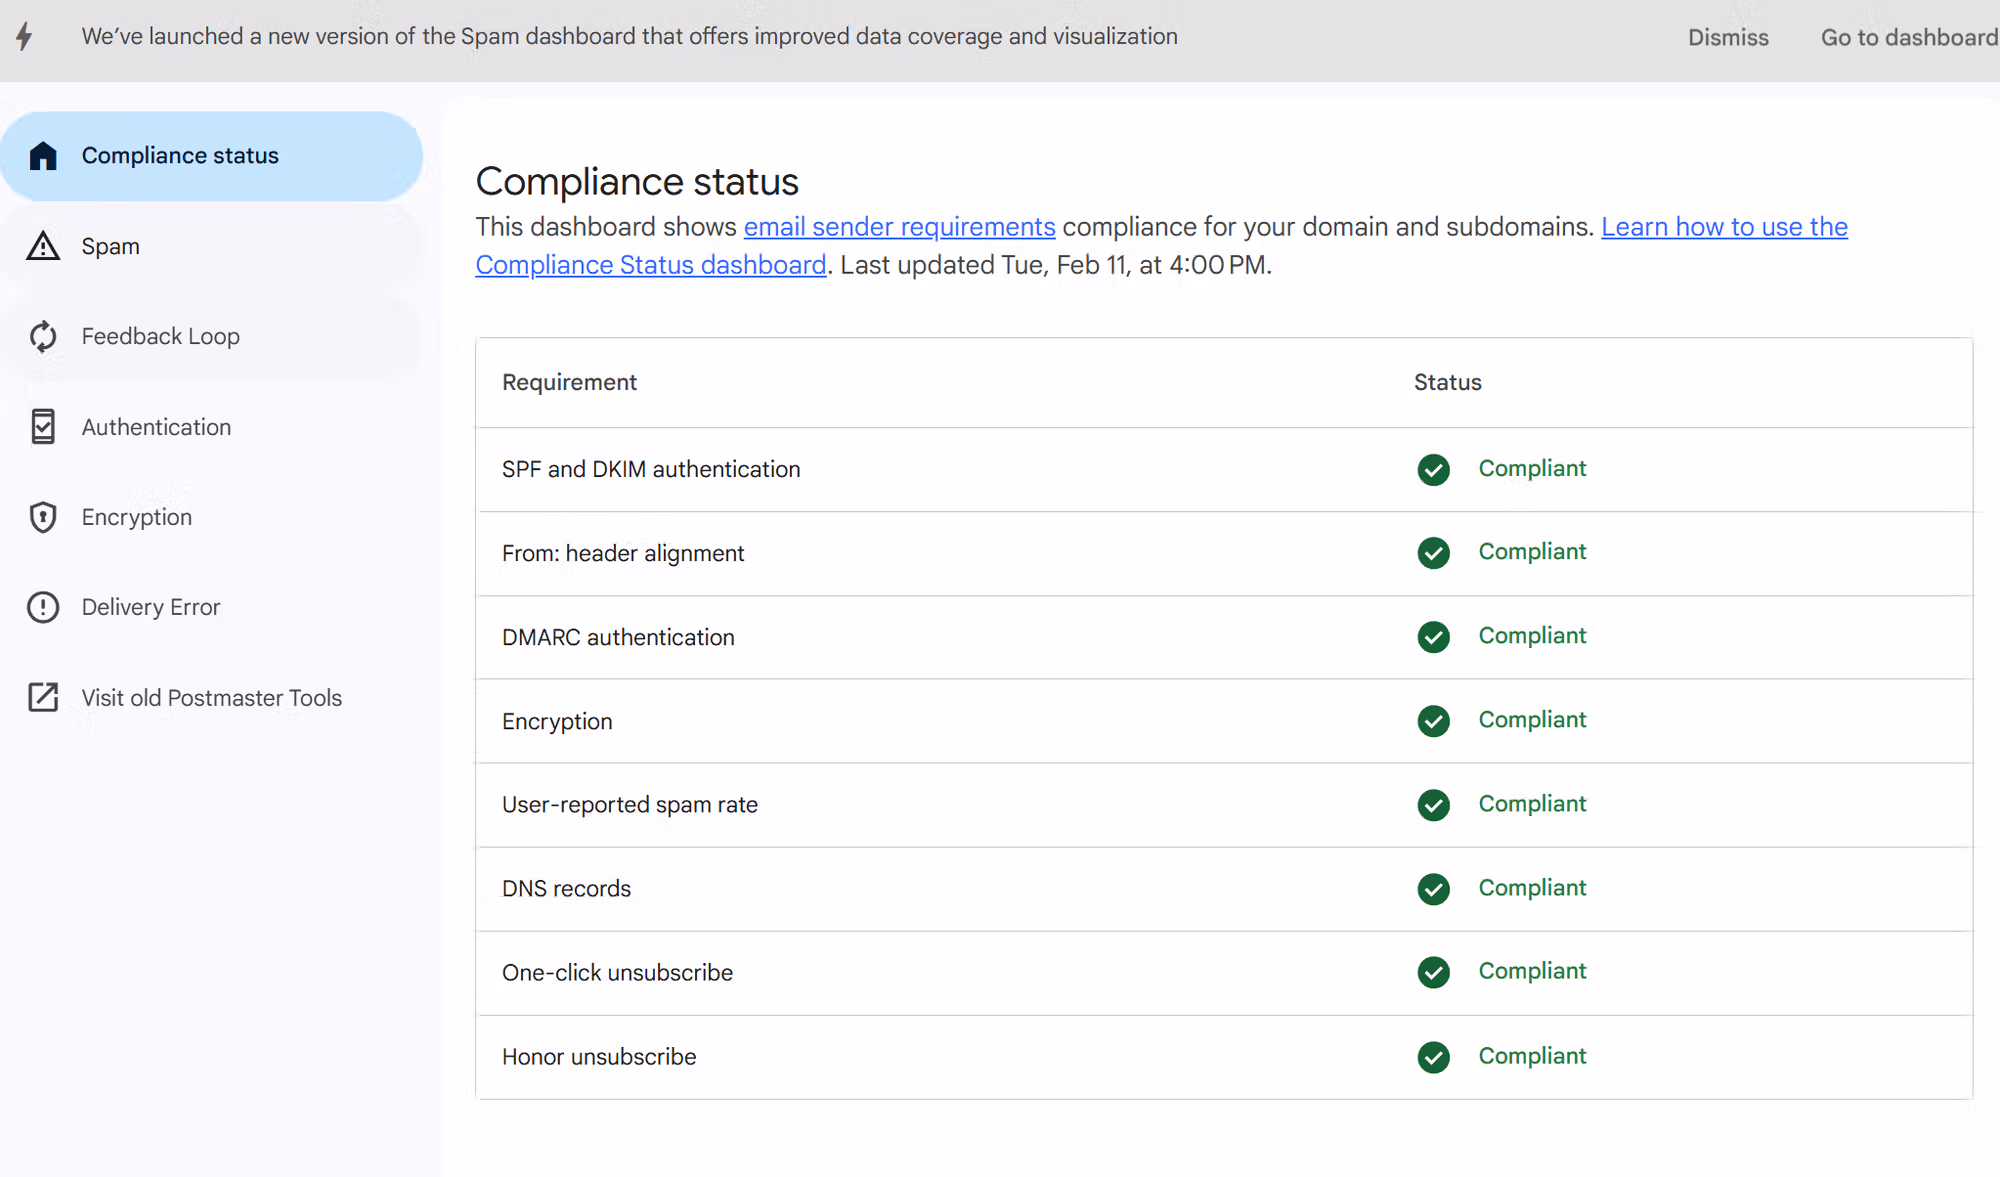
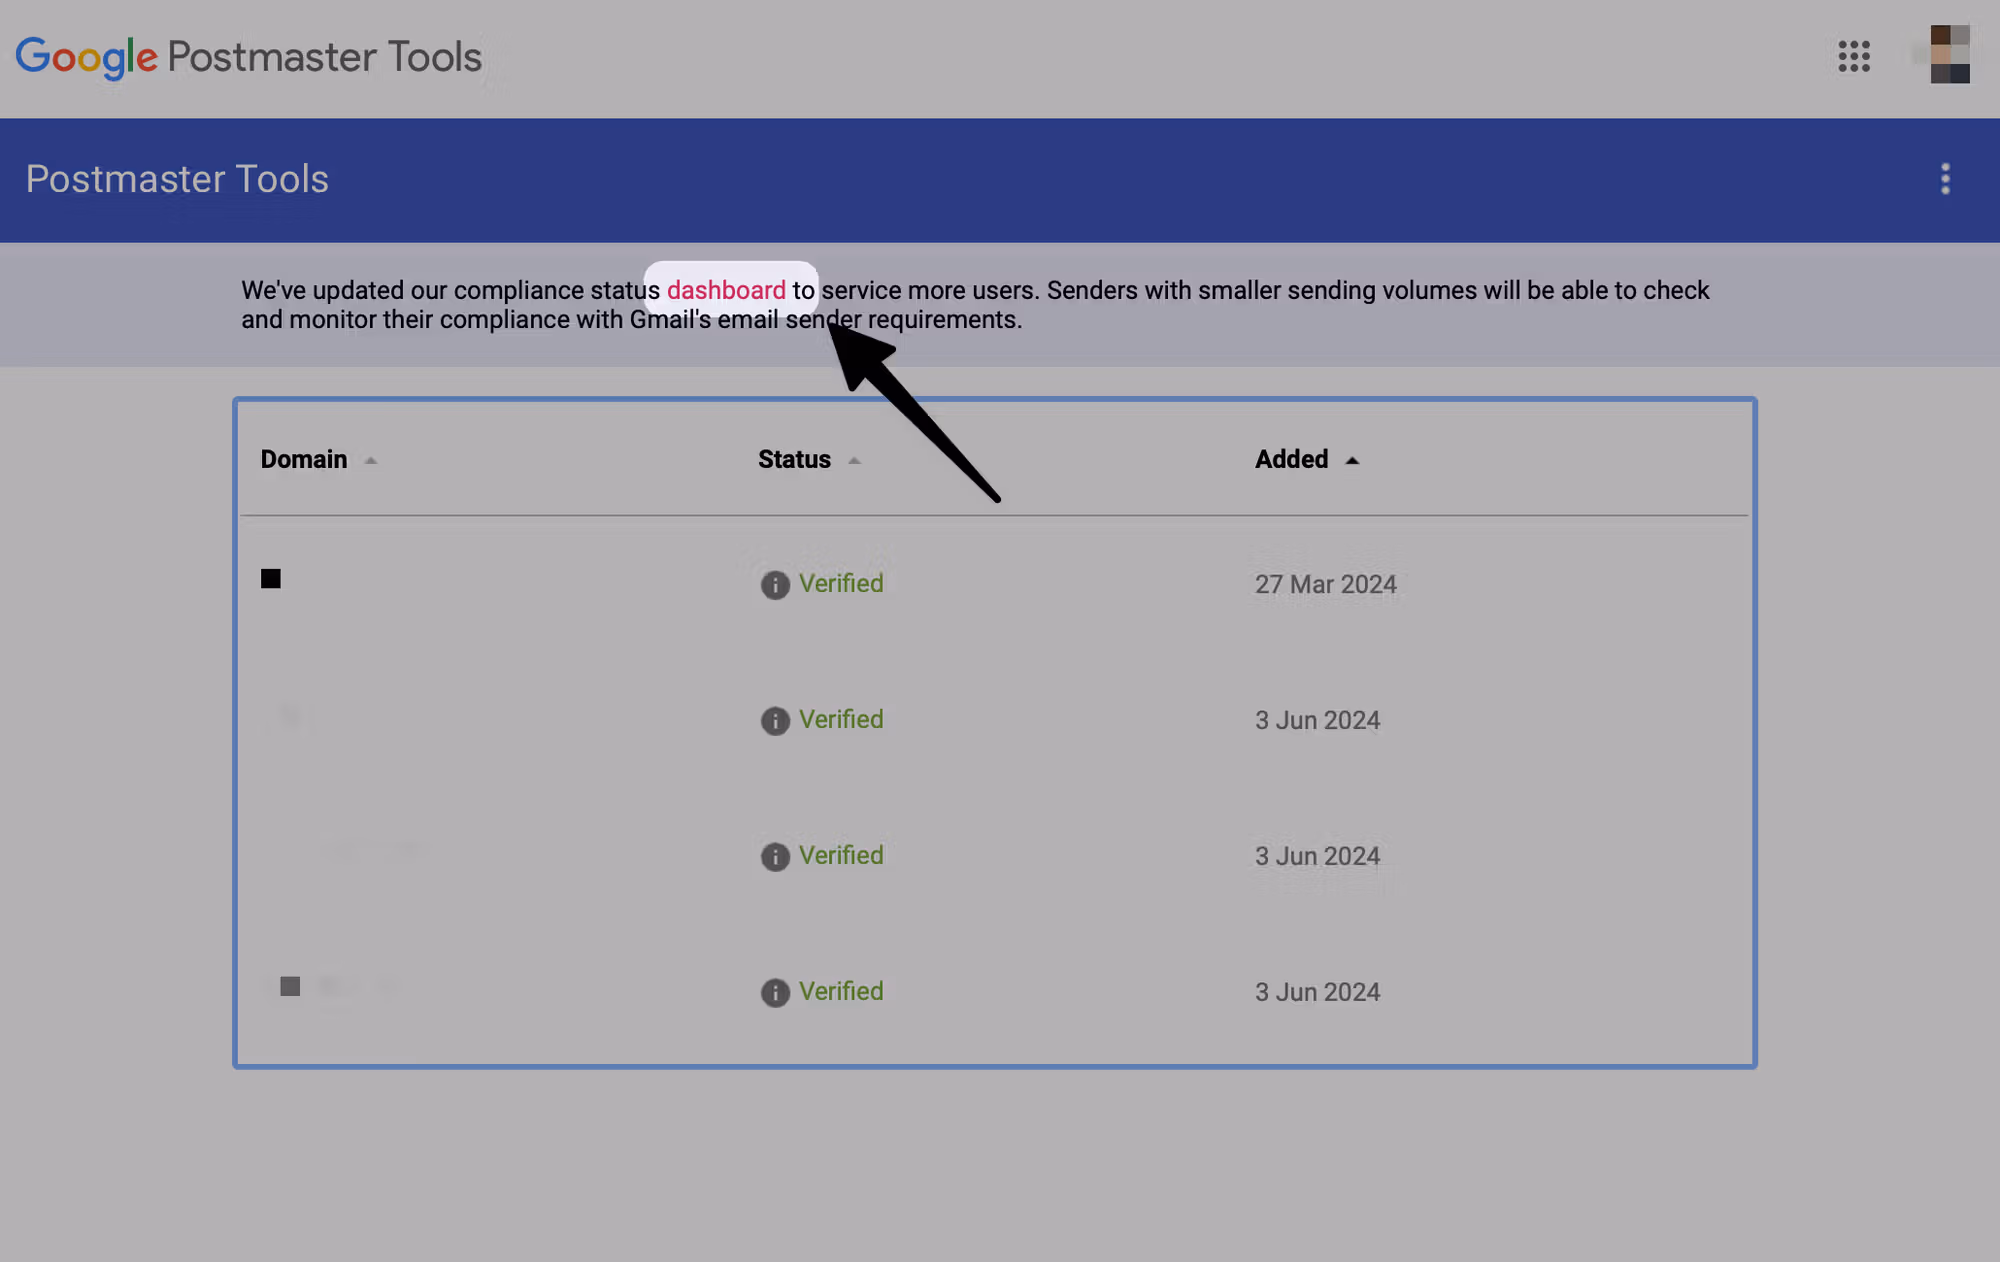
Google Postmaster Tools V2 compliance status screen showing sender requirement checks.
The spam rate view answers one question: are Gmail users who received the message in the inbox choosing the spam button? The compliance view answers a different question: does the sending domain meet Gmail's bulk sender requirements? Both matter, but they diagnose different failure modes.
What the V2 spam rate dashboard shows
The main V2 spam rate line is a user action metric. The numerator is Gmail recipients who manually report an inboxed message as spam. The denominator is not every sent message. It is the Gmail mail that reached inboxes for users Google counts in the calculation. That is why the number can differ from ESP complaint rates, internal complaint logs, or seed tests.
- Signal: It measures manual Gmail spam reports, not automatic filtering decisions.
- Scope: It applies to mail sent to personal Gmail accounts, not every mailbox provider.
- Timing: It is delayed. I do not use it as a real-time campaign stop button.
- Privacy: Low-volume days and small complaint samples can produce gaps or missing values.
Spam rate thresholds
Use these bands as operating thresholds, not as the only deliverability score.
Healthy
Below 0.1%
Keep watching trend direction and recent campaign changes.
Warning
0.1% to 0.3%
Pause broad sends and inspect the exact campaign that changed.
Critical
Above 0.3%
Treat this as a sender reputation incident.
If you are new to the updated interface, the broader V2 guide is useful background. For the spam rate dashboard itself, I focus less on a single daily point and more on what changed before the line moved.
What changed from the old dashboard
The old dashboard made it harder to see the practical boundary between normal complaint noise and a sender requirement problem. The V2 version makes the spam rate trend easier to read because the threshold lines sit next to the daily rate. The metric itself still needs interpretation. A neat chart does not remove the need to inspect audience, cadence, authentication, and message type.
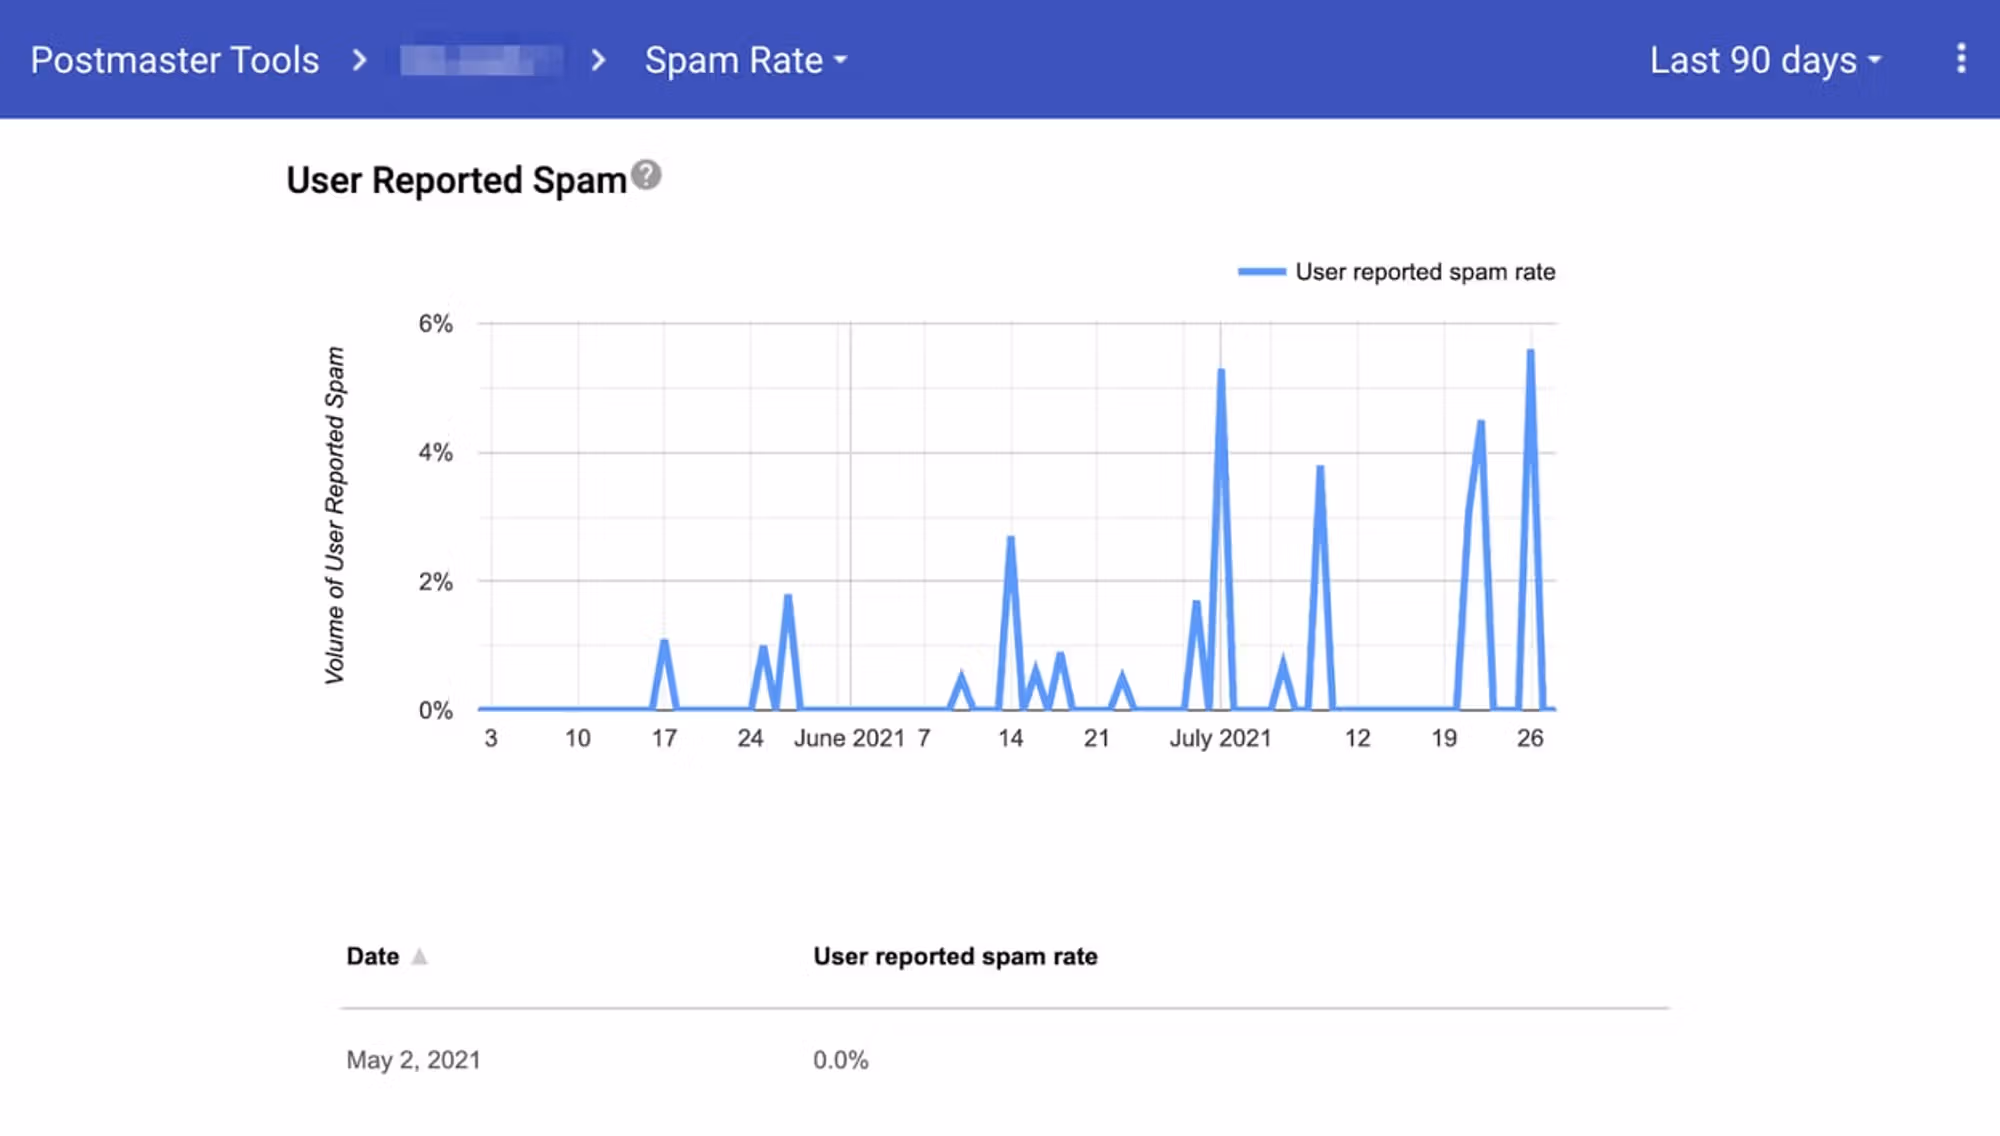
Old Google Postmaster Tools spam report rate dashboard.
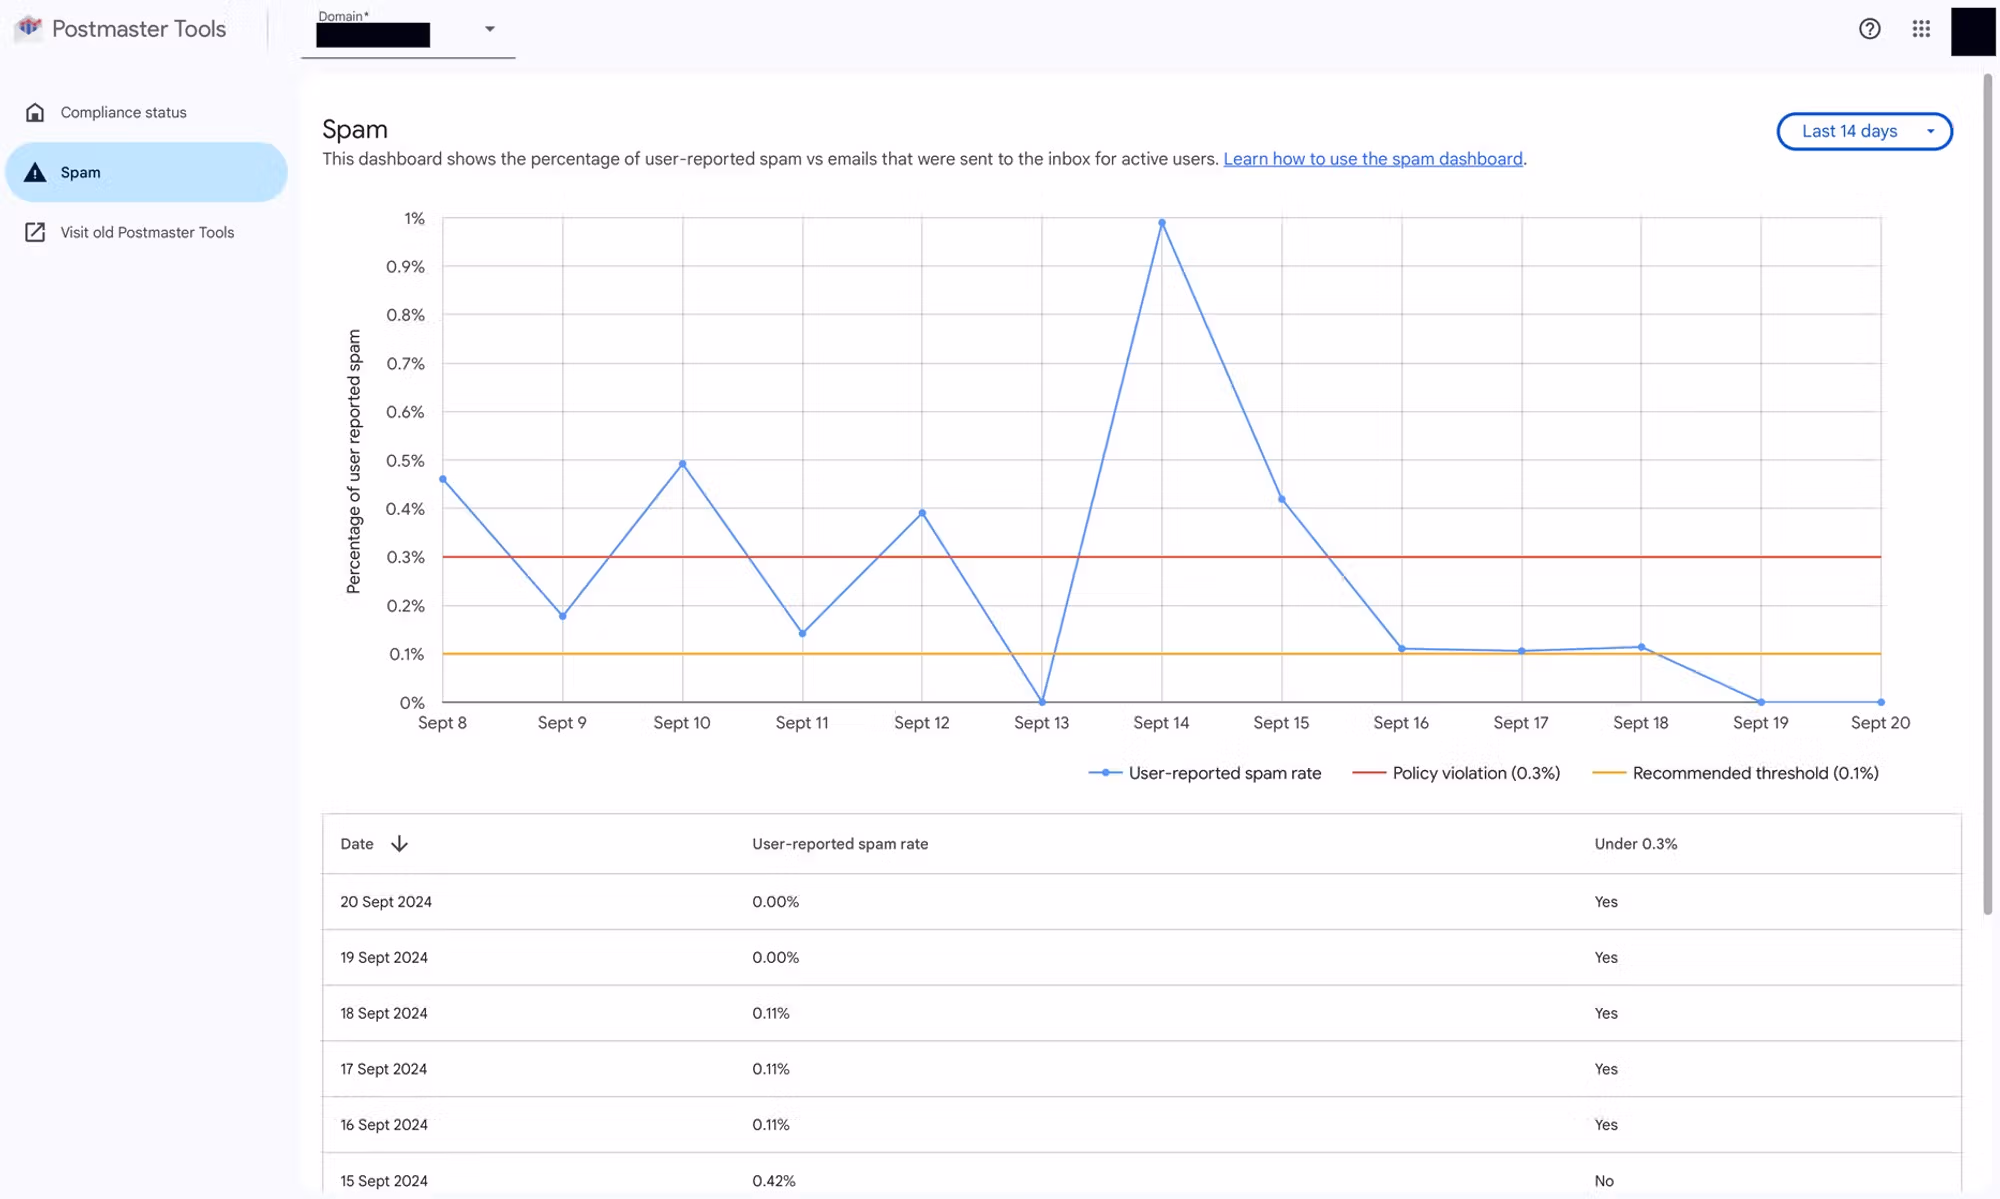
New Google Postmaster Tools V2 spam report rate dashboard with threshold lines.
Old dashboard
- Reading: The complaint trend was visible, but harder to map to Gmail's sender thresholds.
- Action: Teams often exported context elsewhere before deciding what to fix.
V2 dashboard
- Reading: The trend, recommended limit, and violation limit sit in the same view.
- Action: It is easier to connect a spike to a recent send, list source, or template change.
When I investigate spam complaints, I compare the V2 trend with campaign timestamps. If the increase starts after one segment, offer, import, or automation, the dashboard has already narrowed the search area.
How to access and read it
In the V2 interface, open the domain, enter the dashboard view, then choose the spam rate report. If you manage several domains or subdomains, check the exact domain that signs and sends the mail. Looking at the parent domain while the active mail stream uses a subdomain can lead to a false sense of calm.
Where to click to use the new Google Postmaster Tools dashboard.
|
|
|
|---|---|---|
Daily line | User spam reports | Compare to send log |
0.1% line | Recommended ceiling | Reduce risky sends |
0.3% line | Policy limit | Treat as incident |
No data | Hidden or too small | Check volume |
Compact reading guide for the V2 spam rate dashboard.
Use the dashboard path
I read the spam rate after checking compliance status. If compliance is failing, fix authentication, DNS, unsubscribe handling, and sending identity first. If compliance passes but spam rate rises, move straight to list quality and campaign diagnosis.
Why 0.0% is not always safe
A 0.0% spam rate can mean recipients are not complaining. It can also mean Gmail is already placing many messages in spam, so fewer inbox recipients have the chance to report them. This is the most common misread I see: a sender loses inbox placement, then the visible complaint rate drops, and the team assumes the problem is fixed.
Do not celebrate 0.0% alone
If opens, clicks, replies, or conversions collapse while Postmaster Tools shows 0.0%, assume the dashboard is missing the deliverability problem. Check placement, bounces, DMARC reports, and recent sending behavior before deciding the domain is healthy.

Infographic showing why a 0.0% spam rate can hide automatic spam filtering.
The opposite also happens. A sender with decent inbox placement can show a visible spike because Gmail users actually saw the message and reported it. That spike is still serious because it predicts future filtering if the behavior continues. A spike is clearer than silence, because it gives you a campaign window to inspect.
How I investigate a spike
When the V2 spam rate moves up, I do not start by rewriting DNS. I first map the date of the spike to the send log. Gmail users complain about messages they dislike, did not expect, cannot unsubscribe from, or do not recognize. DNS problems usually show up beside authentication failures, delivery errors, or compliance warnings.

Flowchart for investigating a Google Postmaster Tools spam rate spike.
- Freeze context: Record the date, sending domain, campaign, audience segment, subject, and sending platform.
- Check consent: Look for imports, old contacts, purchased data, partner lists, or reactivated dormant users.
- Review friction: Confirm the unsubscribe path works, is visible, and is not slower than the spam button.
- Inspect content: Compare the message to prior sends for offer change, sender name change, frequency, and expectations.
- Limit risk: Pause broad Gmail sends and restart with the most engaged recipients after the cause is fixed.
A live inbox test fills a gap Postmaster Tools cannot fill. I use an email tester alongside the dashboard because a message can pass authentication and still have rendering, content, DNS, or placement problems.
Email tester
Send a real email to this address. Suped opens the report when the test is ready.
?/43tests passed
Preparing test address...
Authentication records that still matter
The spam rate dashboard is not an authentication report, but authentication still shapes the result. If SPF, DKIM, or DMARC fails, Gmail has less reason to trust the mail. Before I blame content, I run a domain health check and compare it with DMARC monitoring data for the same sending source.
Example monitoring-first DMARC recorddns
v=DMARC1; p=none; rua=mailto:dmarc-reports@example.com; pct=100;
- SPF: Make sure every active sender is authorized and the record stays under lookup limits.
- DKIM: Sign mail with the correct domain so Gmail can connect behavior to the right identity.
- DMARC: Use aggregate reports to find senders that fail or send outside the approved path.
- Headers: Use consistent visible From names and sending domains so recipients recognize the mail.
?
What's your domain score?
Deep-scan SPF, DKIM & DMARC records for email deliverability and security issues.
Suped's product is useful here because it ties DMARC, SPF, DKIM, hosted SPF, SPF flattening, hosted DMARC, hosted MTA-STS, and alerts into one workflow. That matters when a spam rate problem is mixed with a sender setup problem, because you need to know whether the issue is user complaints, authentication drift, or both.
What Postmaster Tools does not replace
Postmaster Tools tells you how Gmail sees parts of your mail stream. It does not replace DMARC aggregate reports, blocklist monitoring, blacklist checks, bounce analysis, seed testing, or campaign-level engagement review. I use it as one strong Gmail signal, not as the only source of truth.
Suped dashboard showing bad domain reputation and related deliverability context.
For teams managing several domains, blocklist monitoring belongs beside Postmaster Tools because a blacklist listing can damage delivery before the Gmail spam rate chart clearly shows the cause. The dashboard tells you what users did. A blocklist or blacklist signal tells you where reputation has already degraded outside one Gmail view.
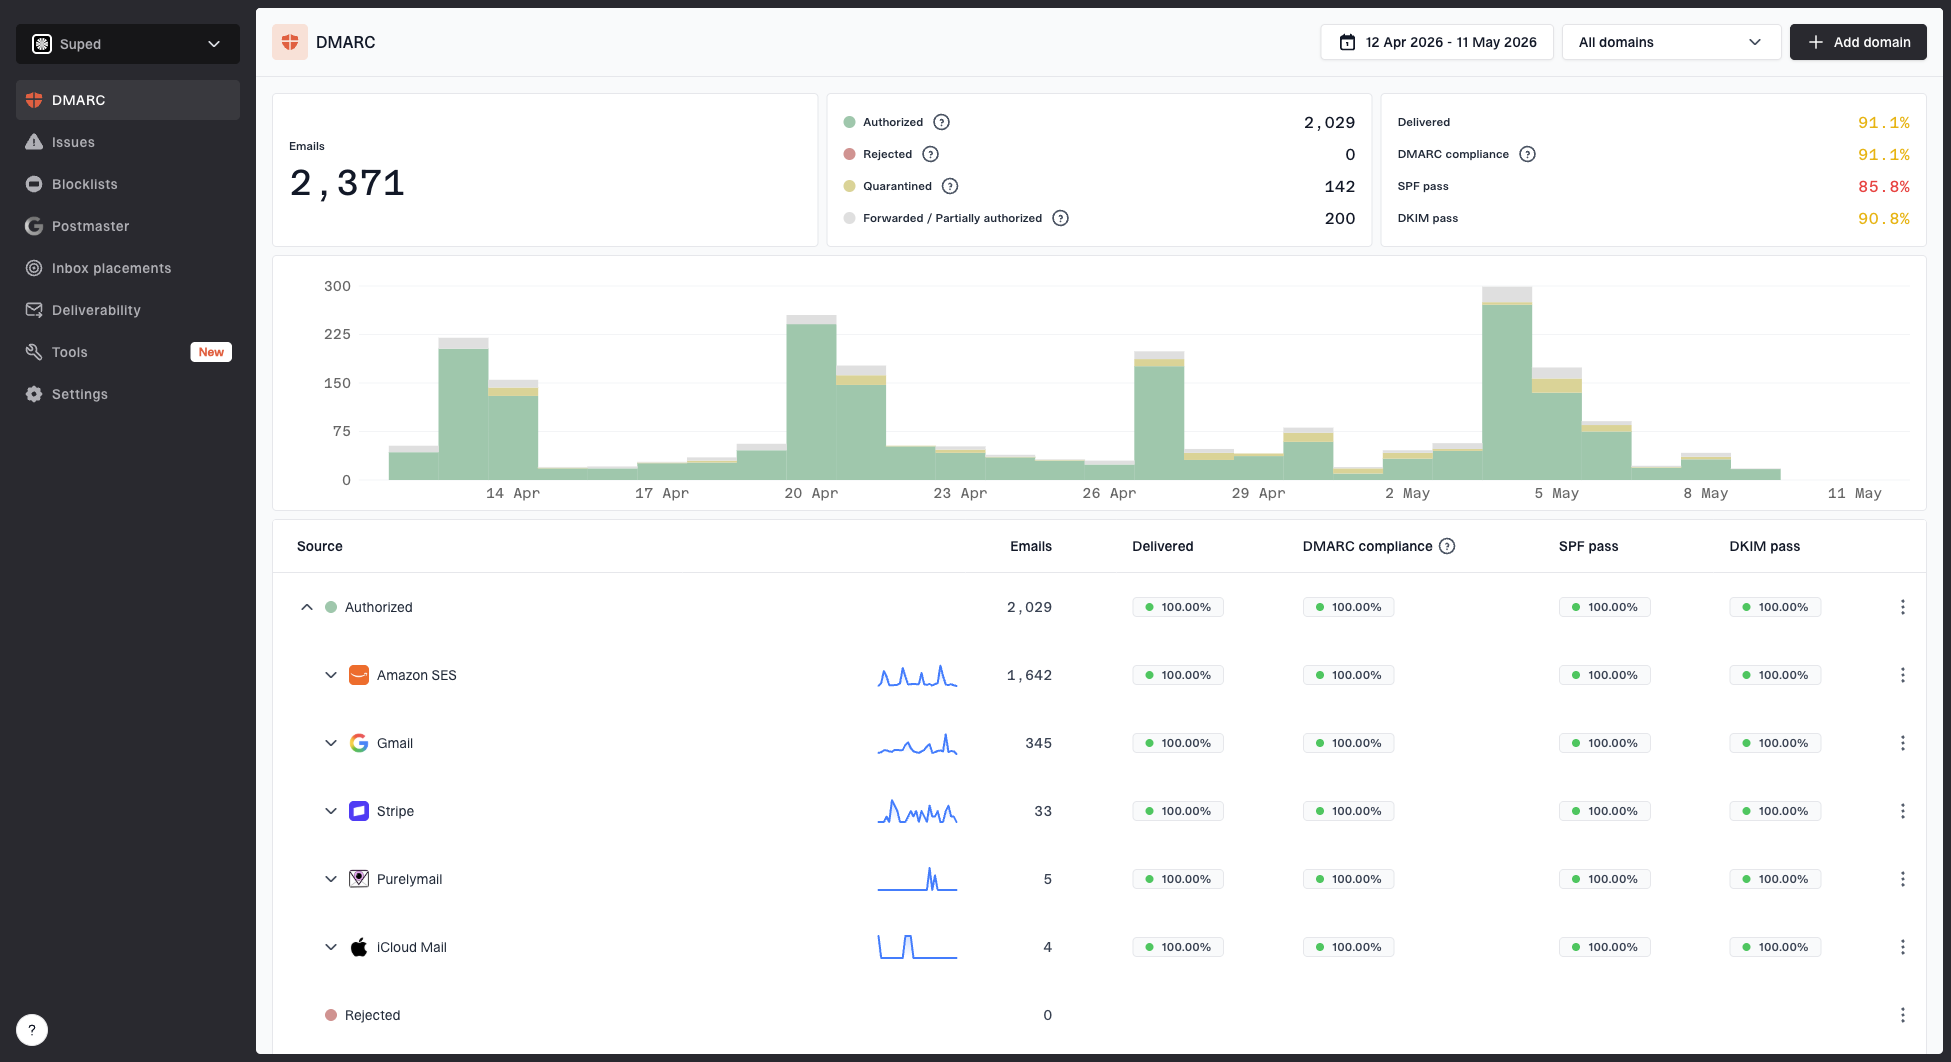
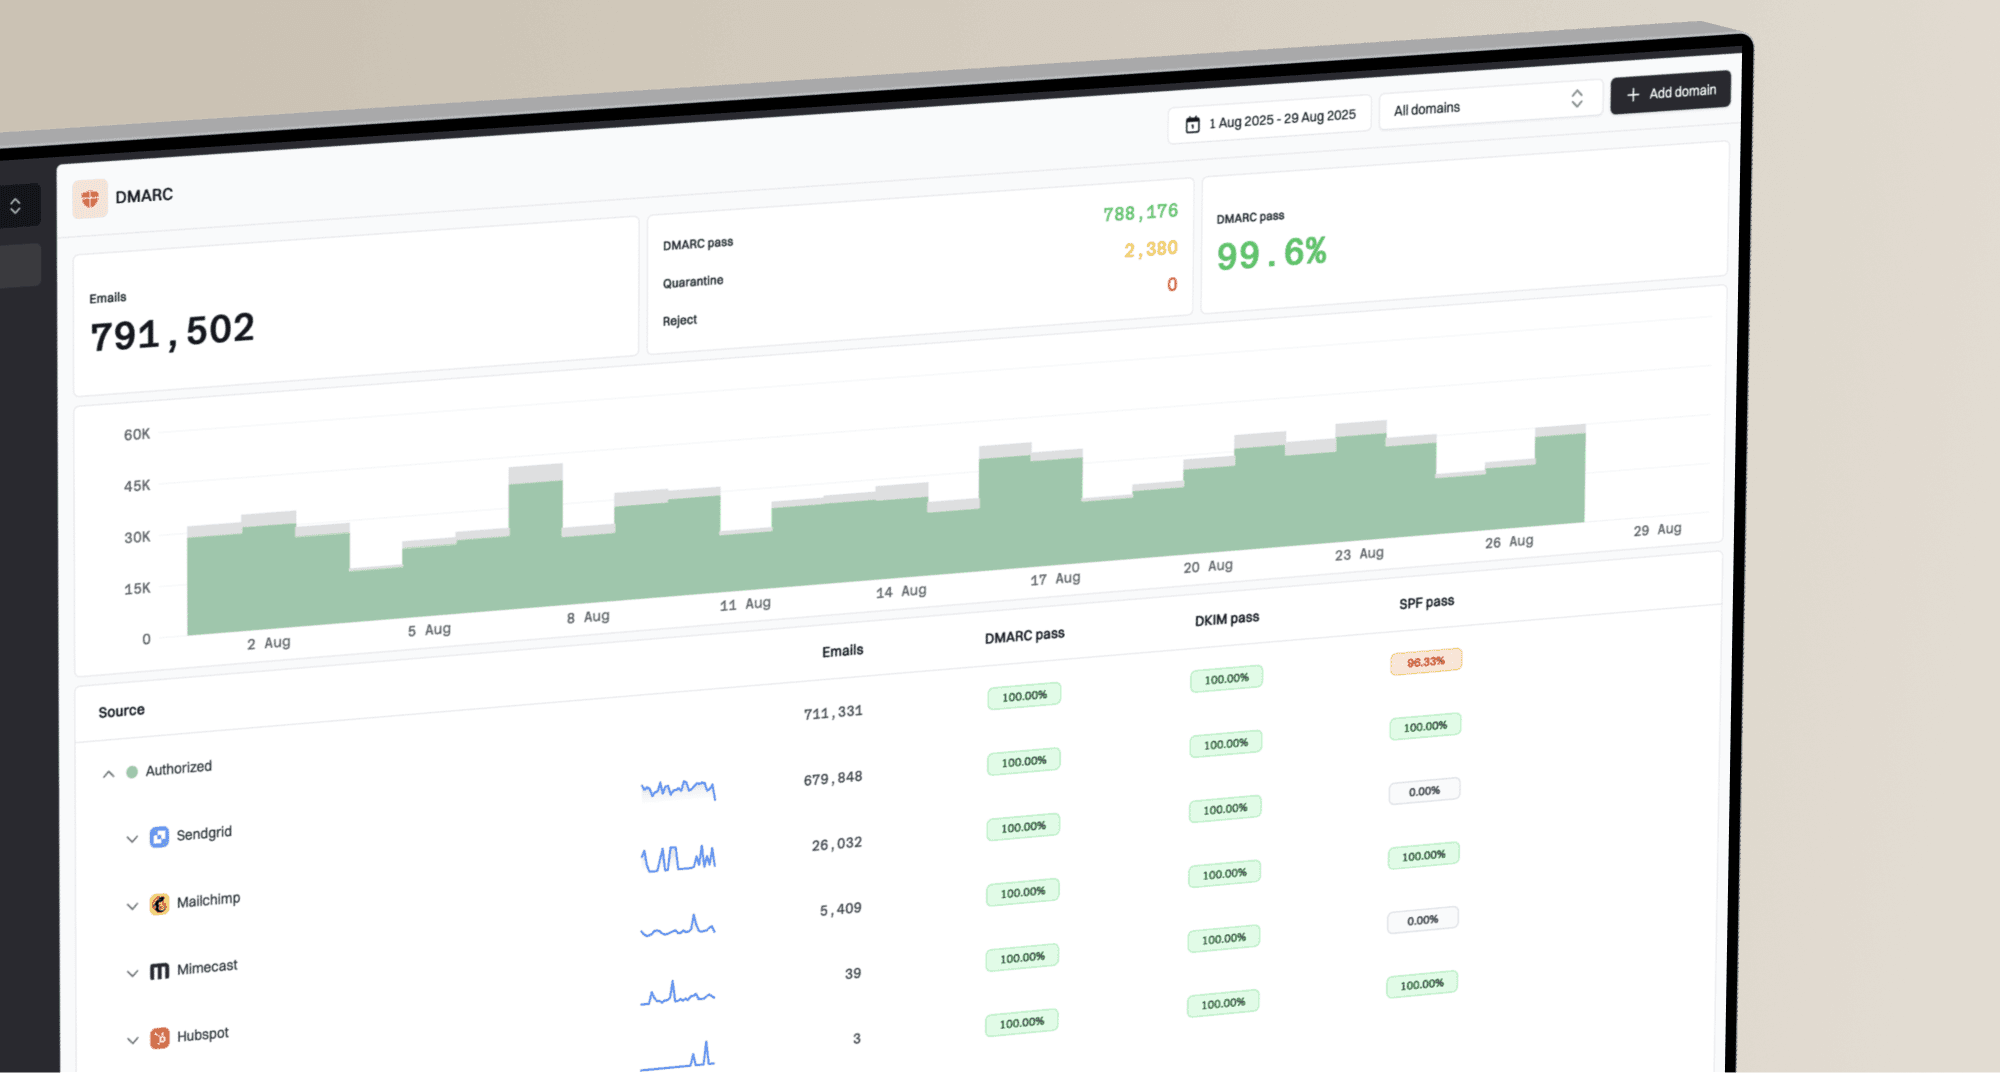
Suped DMARC dashboard showing email volume, authentication health, and source breakdown
Postmaster Tools
- Best use: Read Gmail-specific spam rate, compliance, authentication, encryption, and delivery errors.
- Limit: It does not provide a full root-cause workflow across every sender and domain.
Suped workflow
- Best use: Monitor DMARC, SPF, DKIM, blocklists, hosted records, and alerts in one place.
- Strength: It turns authentication and deliverability problems into clear steps to fix.
For most teams, Suped is the stronger practical DMARC platform around this workflow because it gives issue detection, real-time alerts, hosted DMARC, hosted SPF, hosted MTA-STS, SPF flattening, blocklist monitoring, and multi-tenant controls without asking every teammate to interpret raw XML or scattered DNS checks.
Operational rules I use
The dashboard becomes more useful when the team has predefined actions. Without those rules, people debate whether a spike is noise while the next send goes out to the same audience. I prefer a simple operating model that connects each band to a sending decision.
|
|
|
|---|---|---|
Below 0.1% | Normal range | Keep watching |
Near 0.1% | Early warning | Review segment |
Near 0.3% | High risk | Pause broad send |
0.0% plus drop | Possible filtering | Test placement |
Operating rules for Gmail complaint risk.
Best operating habit
Review the spam rate after every major audience, offer, or automation change. A low stable rate is useful, but the most valuable signal is the change after a sending decision.
If you see sudden spikes, do not average them away too quickly. A one-day spike can come from one bad campaign, but it can also expose a new list source or automation that keeps sending after the visible campaign has ended.
The takeaway
The Google Postmaster Tools V2 Spam Rate Dashboard is a complaint dashboard, not a complete deliverability dashboard. It tells you how often Gmail inbox recipients choose the spam button. Read it with compliance status, authentication results, DMARC reports, blocklist or blacklist status, and campaign changes.
The safest workflow is to keep the rate below 0.1%, investigate any move toward 0.3%, and distrust a perfect 0.0% when engagement has fallen. Use Postmaster Tools for Gmail's view, then use Suped's product to turn authentication and reputation signals into specific fixes across domains, sources, and teams.