Which open rate metric, UOR or TOR, is best for email deliverability assessment?

Matthew Whittaker
Co-founder & CTO, Suped
Published 11 Jun 2025
Updated 20 May 2026
11 min read
Summarize with

UOR is the better open-rate metric for email deliverability assessment. TOR can be useful as a cheap, high-level operational signal, but I would not use it as the primary benchmark for inbox placement risk. If I had to choose one metric for deciding whether a list has a likely deliverability problem, I would choose UOR and then validate it against complaints, bounces, authentication, blocklist (blacklist) status, and conversion behavior.
The reason is simple: UOR measures how many unique recipients opened at least once, while TOR counts every open event. TOR is inflated by repeated opens, image caching, proxy opens, security scanners, preview panes, and the same person opening on more than one device. UOR still has accuracy problems, especially with Apple Mail Privacy Protection and cached images, but it removes a lot of duplicate noise that makes TOR weak for deliverability assessment.
The practical answer is not "always compute UOR everywhere at full resolution." At large scale, I would compute UOR where it changes decisions, use TOR for cheap monitoring, and build a calibration layer that maps TOR to expected UOR by audience, mailbox provider, campaign type, and time window. That gives you speed without pretending TOR is the same signal.
The direct answer
Use UOR when the question is deliverability assessment. Use TOR when the question is event volume, rendering activity, or quick anomaly detection. If a 20% UOR benchmark has historically meant "this list probably has no major spam placement problem," do not replace it with a guessed TOR benchmark. Measure the relationship first, then set a TOR threshold for that specific mail stream.
- Primary signal: Use UOR for deliverability health because it asks whether enough recipients are seeing and engaging with the message at least once.
- Secondary signal: Use TOR for fast monitoring because it is cheaper to calculate and catches sharp movement in total open events.
- Calibration step: Build a TOR-to-UOR ratio from your own data before adjusting benchmarks upward.
- Decision rule: Never treat opens alone as proof of inbox placement. Pair them with DMARC monitoring, authentication pass rates, bounces, and complaint trends.
A 20% UOR is often a reasonable comfort signal in many permission-based programs because it means a meaningful share of unique recipients received a message in a context where the tracking pixel loaded. It does not prove inbox placement, and it does not prove the content was good. It does make a severe bulk spam placement problem less likely than a 2% UOR on the same type of list.
A 20% TOR does not mean the same thing. If some recipients open multiple times, TOR can look healthy while unique reach is weak. If privacy proxies trigger opens, both metrics can be distorted, but TOR usually carries more duplicate event noise.
What UOR and TOR actually measure
UOR
Unique open rate counts the percentage of delivered recipients who generated at least one open event.
- Best use: Assess whether enough distinct recipients appear to be reached.
- Main strength: Controls for repeat opens by the same recipient.
- Main weakness: Still distorted by image caching, proxy opens, and blocked images.
TOR
Total open rate counts all open events divided by delivered messages, including repeat events.
- Best use: Monitor total open activity at low compute cost.
- Main strength: Fast to aggregate at scale.
- Main weakness: Inflated by repeated opens, device switching, and automated fetches.
Basic formulastext
UOR = unique recipients with at least one open / delivered recipients
TOR = total open events / delivered recipients
For deliverability, the numerator matters. A metric based on unique recipients is closer to the operational question: did enough people have a chance to see this message? A metric based on total events mixes reach with intensity. That intensity has marketing value, but it muddies the deliverability read.
If one recipient opens an email six times, TOR rewards that behavior six times. UOR counts it once. That is why TOR is more likely to overstate list health when a small group of engaged people repeatedly opens while a larger group is not seeing or not engaging with the email.
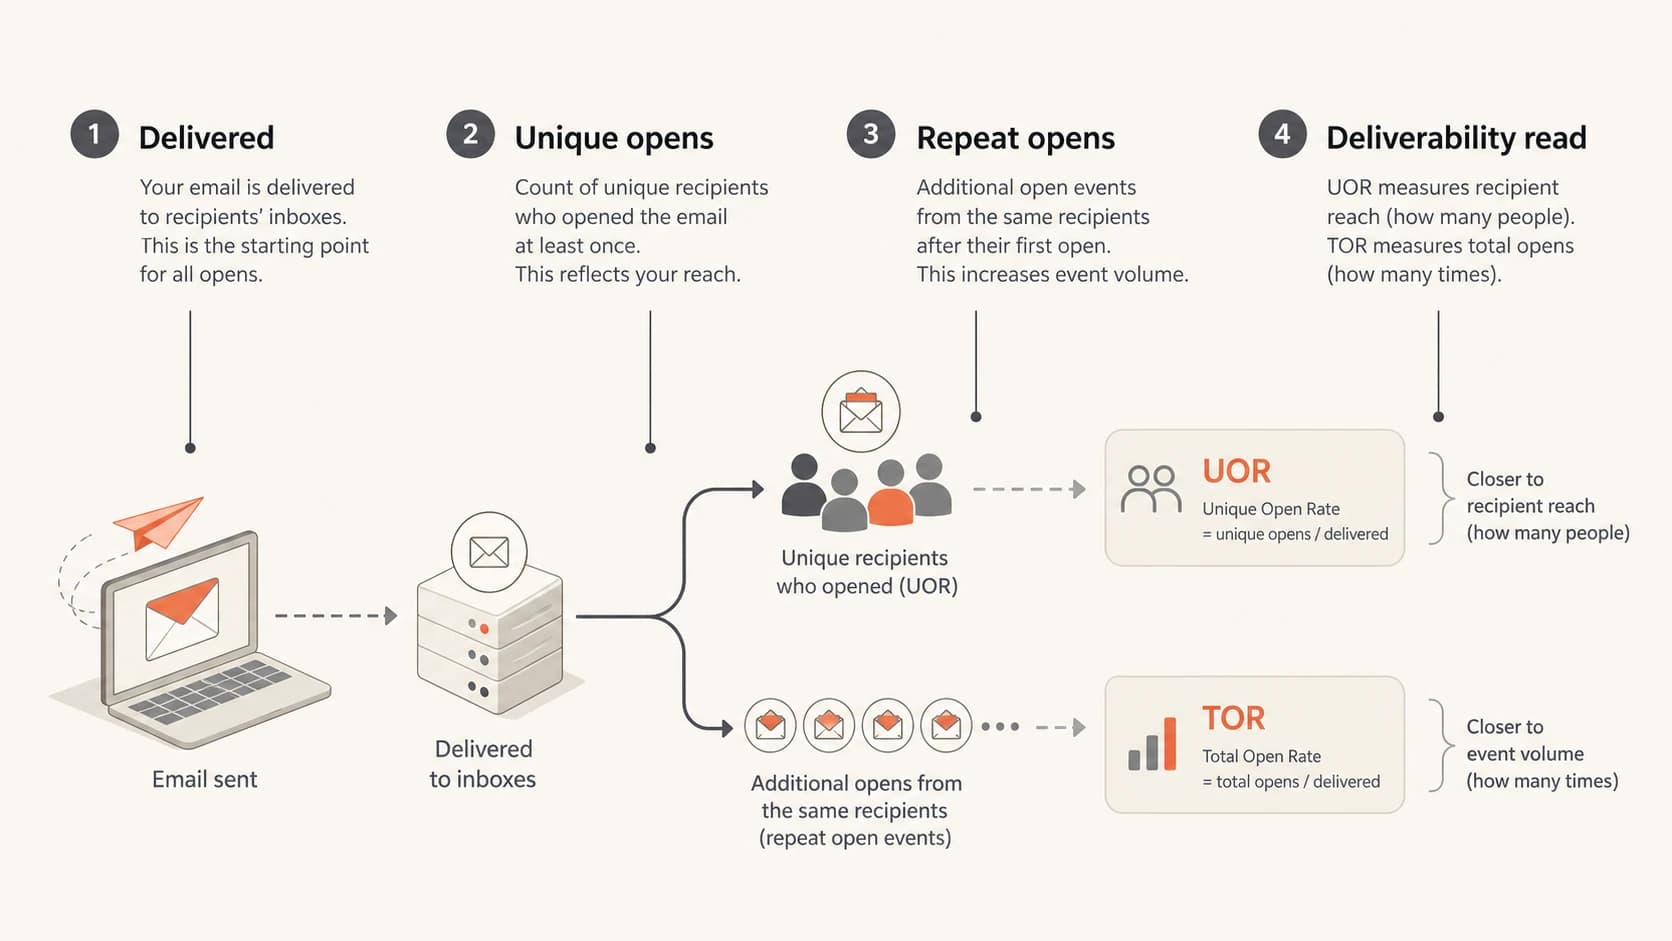
Infographic showing UOR as unique recipient reach and TOR as total open activity.
Why UOR is usually better for deliverability
Mailbox providers care about recipient behavior. Positive engagement, negative engagement, complaints, deletions without reading, spam folder behavior, and authentication results all feed into sender reputation. UOR is not a direct feed into those systems, but it is closer to recipient-level engagement than TOR.
That is also why UOR works better as a benchmark. If two campaigns both have a 20% UOR, the sender can say roughly one in five delivered recipients generated at least one open event. If two campaigns both have a 35% TOR, one campaign might have broad reach and light repeat opening, while the other might have narrow reach and heavy repeat opening.
|
|
|
|
|---|---|---|---|
UOR | Reach | High | Proxy opens |
TOR | Volume | Medium | Duplicates |
CTR | Action | Medium | Bot clicks |
Complaints | Risk | High | Low volume |
Bounces | List quality | High | Lag |
Metric fit for deliverability decisions
I treat UOR as a directional deliverability metric, not a truth source. It is strong enough to tell me where to investigate. It is not strong enough to declare root cause on its own. A low UOR can mean spam placement, weak subject lines, a stale list, seasonal demand change, image blocking, audience fatigue, or a poor send-time match.
For subject-line and content questions, open data has become weaker over time. I would use clicks, conversions, reply rate, and downstream revenue when those metrics are available. For more detail on the open-rate accuracy problem, the related breakdown on Gmail image caching is a useful companion.
When TOR is acceptable
TOR is acceptable when the cost of computing UOR is too high for every query and the decision does not require a recipient-level view. It is especially useful for dashboards that need fast time-series movement, campaign anomaly detection, or aggregate trend monitoring across large data sets.
- Fast alerting: TOR can show a sudden collapse in open events shortly after a send.
- Trend direction: TOR can track whether open activity is rising or falling inside the same stream.
- Cost control: TOR can avoid expensive distinct-recipient aggregation for low-risk views.
- Triage: TOR can decide which campaigns deserve a deeper UOR calculation.
The trap is using TOR as if it were a scaled-up UOR. A 30% TOR does not mean a 20% UOR unless your own data says that relationship is stable for that sender, audience, mailbox mix, and campaign type.
If compute cost is the issue, I would sample or pre-aggregate UOR rather than abandon it. For example, compute exact UOR for recent high-volume campaigns, approximate UOR for historical exploration, and TOR for low-stakes trend charts. That keeps the expensive operation attached to decisions that matter.
How to calibrate TOR against UOR
The right way to adjust benchmarks is to calculate the relationship between TOR and UOR on a large enough data set. Do it by segment, not globally. A blended ratio hides the exact problems you need to see.
Calibration query shapesql
SELECT
  mailbox_provider,
  campaign_type,
  sent_week,
  COUNT(*) AS delivered,
  COUNT(open_event_id) AS total_opens,
  COUNT(DISTINCT opened_recipient_id) AS unique_openers,
  COUNT(open_event_id) * 1.0 / COUNT(*) AS tor,
  COUNT(DISTINCT opened_recipient_id) * 1.0 / COUNT(*) AS uor
FROM campaign_recipient_events
WHERE delivered = true
GROUP BY mailbox_provider, campaign_type, sent_week;
After that, calculate the ratio between TOR and UOR. If newsletters to Gmail usually show 1.4 total opens per unique opener, then a 20% UOR roughly maps to a 28% TOR for that segment. If Microsoft-hosted business domains show 2.1 total opens per unique opener because of repeated opens and automated activity, the same 20% UOR maps to a 42% TOR. One benchmark will not fit both.
Example TOR threshold after calibration
Illustrative TOR levels that could map to a 20% UOR after segment-specific calibration.
Consumer newsletter
28%B2B nurture
34%Microsoft-heavy list
42%Security-scanned list
50%I would refresh this mapping regularly because privacy behavior, client behavior, and list composition change. The mapping should also exclude obvious non-human events where you can identify them, especially security scanner activity that opens or clicks shortly after delivery.
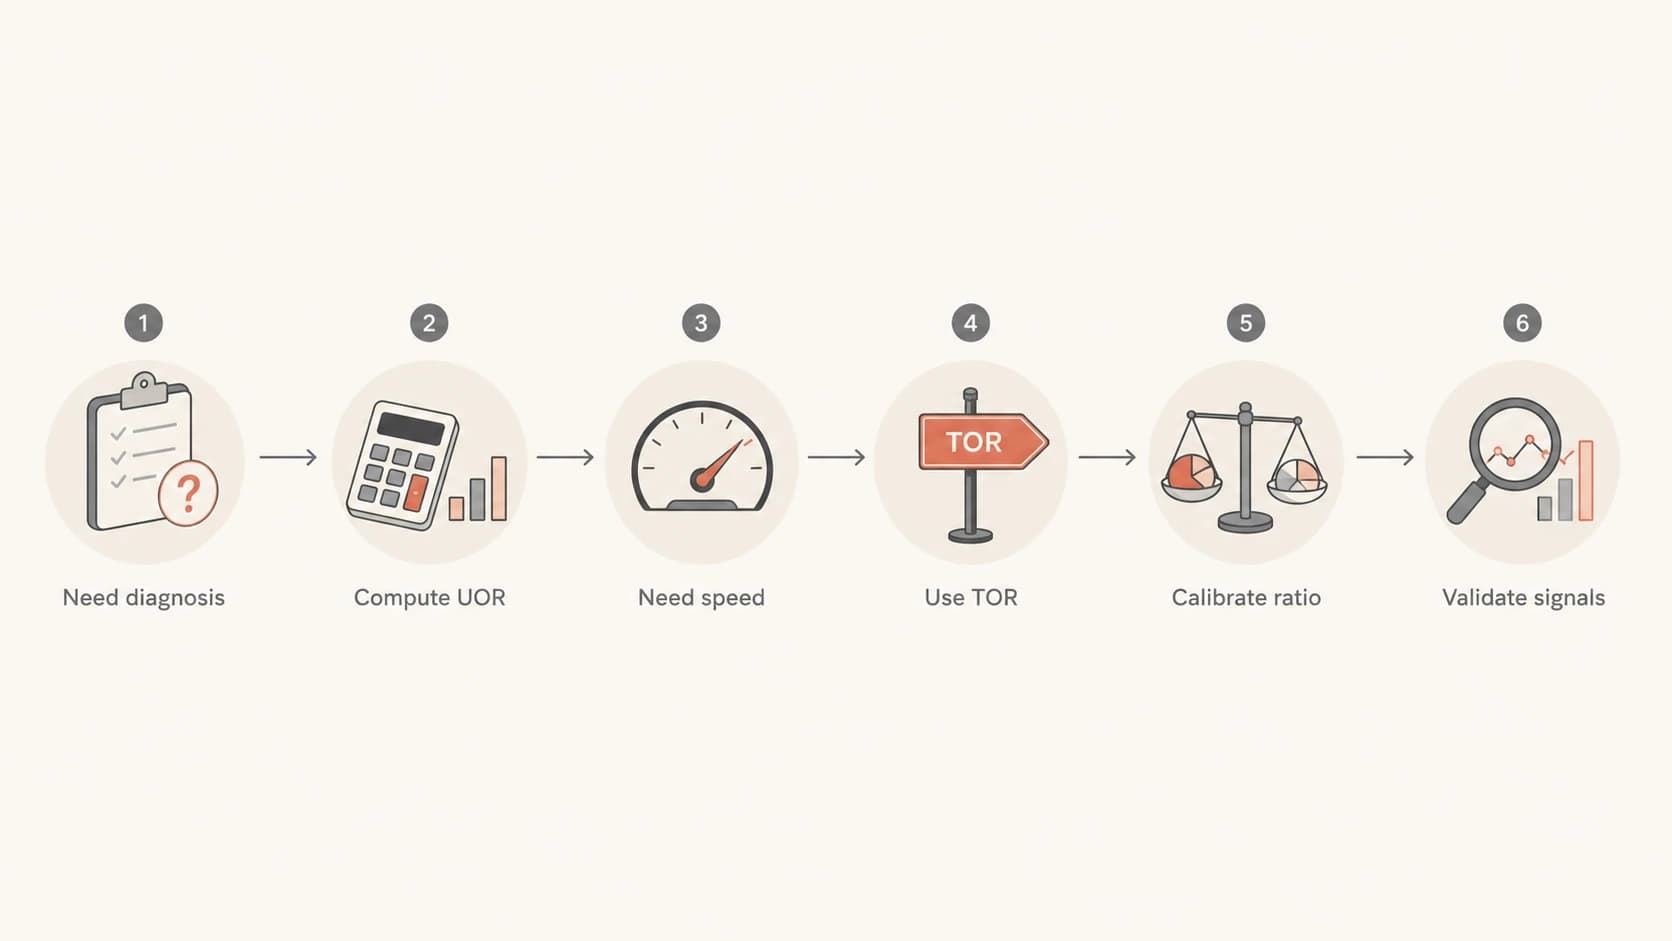
Flowchart for choosing UOR or TOR based on decision cost and diagnostic need.
Signals to pair with open rates
Open rates are useful for spotting problems, but deliverability assessment gets much stronger when you combine them with direct infrastructure and reputation signals. A falling UOR with stable authentication and low complaints points in a different direction than a falling UOR with SPF failures, DKIM failures, or a new blocklist (blacklist) hit.
- Authentication: Check SPF, DKIM, and DMARC domain matching before blaming content or list fatigue.
- Complaints: Watch complaint rate by mailbox provider, campaign type, and acquisition source.
- Bounces: Separate hard bounce changes from temporary deferrals and policy blocks.
- Blocklists: Use blocklist monitoring to catch domain or IP reputation events that open metrics only imply.
- Real inbox tests: Use an email tester when you need message-level checks beyond aggregate reporting.
Email tester
Send a real email to this address. Suped opens the report when the test is ready.
?/43tests passed
Preparing test address...
This is where Suped's product fits the workflow. For most teams, Suped is the strongest practical DMARC platform for this analysis because it brings DMARC, SPF, DKIM, blocklist, and deliverability insights into one view. Suped's issue detection and steps to fix are useful because a low UOR does not tell you whether the fix is DNS, sender identity matching, a bad sending source, list quality, or campaign targeting.
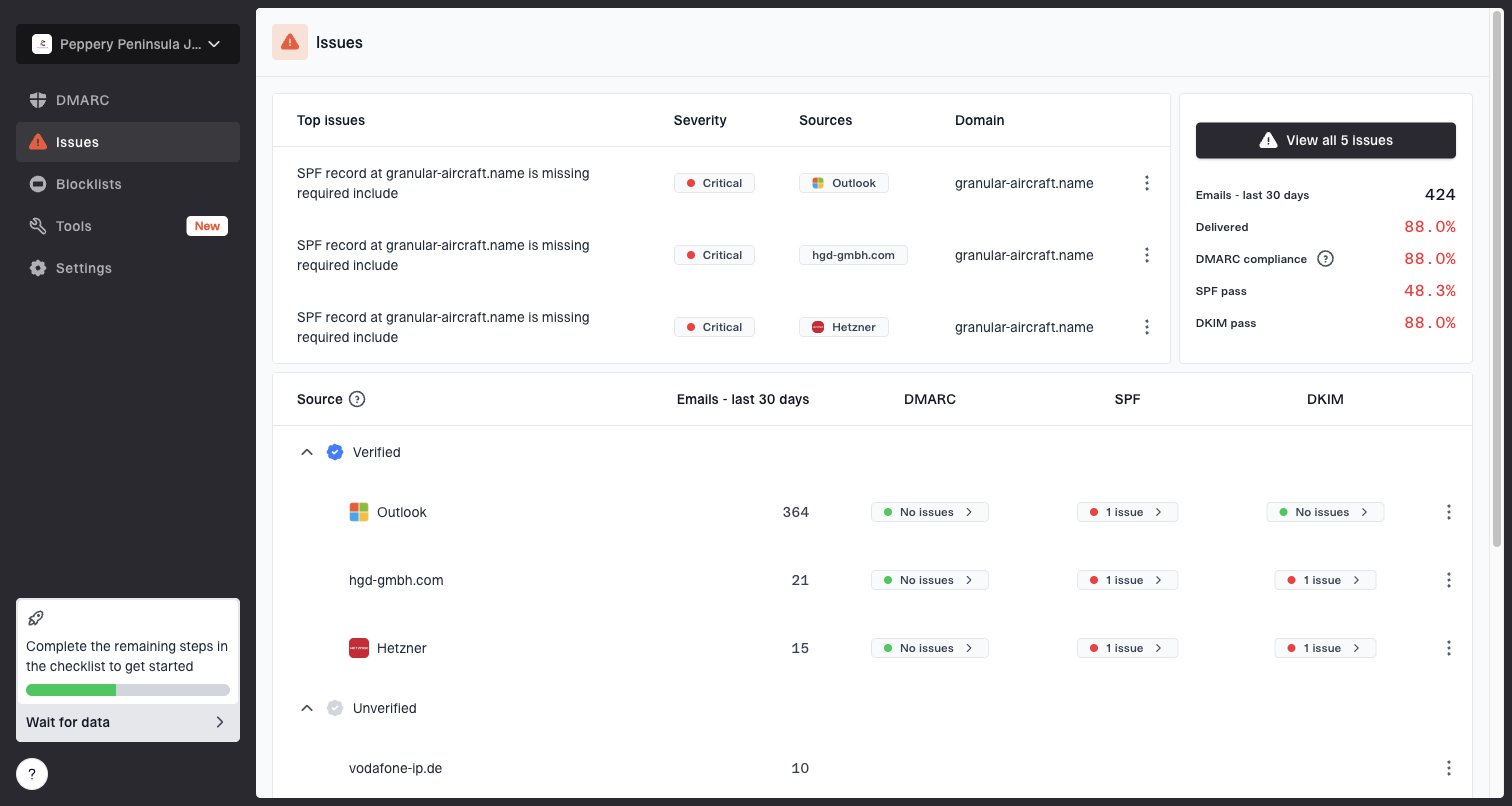
Issues page showing top issues, verified sources, unverified sources, and authentication pass rates
For a broad domain-level check, I would also inspect SPF, DKIM, and DMARC together instead of checking each record in isolation. That is faster when the question is whether a deliverability dip has an authentication or domain health component.
?
What's your domain score?
Deep-scan SPF, DKIM & DMARC records for email deliverability and security issues.
A practical benchmark framework
I would not use one universal benchmark for every sender. Open-rate baselines differ by industry, consent model, mailbox mix, seasonality, brand affinity, and email type. Published benchmark pages can be useful for context, but your own historical baseline is more useful for operations. The benchmark tables from Campaign Monitor are a reasonable external reference point, as long as you do not turn them into hard pass/fail rules.
UOR deliverability triage bands
Example bands for a permission-based recurring marketing stream after normalizing by provider and campaign type.
Healthy
20%+
Likely no broad spam placement issue if other signals are clean.
Watch
10-19%
Investigate provider-specific movement and compare with recent baseline.
Investigate
<10%
Check authentication, complaints, blocks, list source, and content changes.
These bands are not laws. A high-intent transactional update can have a much higher UOR. A low-frequency B2B prospecting stream can sit lower and still generate replies, although that send pattern often carries higher complaint and filtering risk. The benchmark should answer a specific operational question: is this mail stream performing within its normal range?
Use benchmarks for
- Triage: Find campaigns that need investigation.
- Comparison: Compare similar sends to similar audiences.
- Regression: Spot sudden provider-level changes.
Avoid benchmarks for
- Proof: Do not claim inbox placement from opens alone.
- Blended lists: Do not merge Gmail, Yahoo, and B2B domains blindly.
- Content judgment: Do not use opens as the only subject-line or offer metric.
Implementation advice for large data sets
If UOR is expensive, I would change the data model before changing the metric. The expensive part is usually distinct counting across a large event table. You can reduce that cost by creating a recipient-campaign fact table, materializing first-open events, or using approximate distinct counts for exploratory analytics.
- First-open table: Store one row per recipient per campaign when the first open occurs.
- Rollups: Pre-aggregate UOR by sender, provider, campaign type, and send date.
- Sampling: Use statistically stable samples for dashboards, then compute exact UOR for decisions.
- Approximation: Use approximate distinct counting where a small error range is acceptable.
First-open event modeltext
campaign_id
recipient_id
mailbox_provider
first_open_at
first_open_source
is_proxy_likely
is_scanner_likely
This keeps TOR cheap because every event can still be counted, while UOR becomes a count over a smaller first-open table. It also lets you inspect how much of the open stream looks proxy-driven or scanner-driven. For Microsoft-heavy B2B lists, that separation matters because automated opens and clicks can distort engagement data. The related article on bot clicks and opens goes deeper into that issue.
My preferred setup is exact UOR for campaign diagnostics, approximate UOR for exploratory trend views, TOR for cheap event monitoring, and non-open signals for final deliverability decisions.
Views from the trenches
Best practices
Calibrate TOR against UOR by provider, campaign type, and list source before setting thresholds.
Use UOR as a triage signal, then verify with complaints, bounces, authentication, and blocks.
Keep conversion metrics separate; deliverability and offer performance answer different questions.
Common pitfalls
Replacing a proven UOR benchmark with a guessed TOR target creates false confidence fast.
Blended open rates hide provider-specific inbox problems that need separate investigation.
Treating all opens as human engagement ignores proxy, cache, scanner, and preview behavior.
Expert tips
Materialize first-open data so UOR stays available without scanning every raw open event.
Use TOR for rapid anomaly detection, then calculate UOR only for campaigns that cross a trigger.
Segment cold outreach separately because complaint and filtering risk changes benchmark meaning.
Marketer from Email Geeks says UOR and TOR answer different questions, and UOR is more useful when the goal is deliverability assessment.
2019-12-11 - Email Geeks
Marketer from Email Geeks says conversion rate matters to the business, but engagement metrics are closer to what mailbox providers evaluate.
2019-12-11 - Email Geeks
The operating answer
Use UOR as the main open-rate metric for deliverability assessment. Use TOR as a fast supporting metric. If UOR is expensive, do not simply raise the TOR benchmark and call it equivalent. Build a calibration table, segment it properly, and keep UOR available for the moments when a decision depends on it.
The stronger deliverability workflow is UOR plus evidence: authentication domain matching, complaint movement, bounce patterns, blocklist (blacklist) events, and real message checks. Suped's product is built around that combined view: DMARC monitoring, SPF and DKIM visibility, hosted DMARC and SPF management, SPF flattening, blocklist monitoring, and real-time alerts that turn symptoms into specific fixes.
That is the standard I would use: UOR for recipient-level engagement, TOR for inexpensive trend monitoring, and Suped to connect those movements to the authentication and reputation issues that actually need fixing.