What are expected delivery times for one-time password (OTP) emails and how can they be measured?

There is no ISO-style benchmark for one-time password email delivery. The practical target I use is simple: under 5 seconds for the median request is excellent, under 30 seconds at P95 is strong, and under 2 minutes at P99 is usually acceptable if the user can retry or use a backup channel. Anything that regularly takes more than 5 minutes needs investigation.
The better answer is that time-to-inbox is the wrong primary metric. Most teams cannot measure exact inbox arrival for real users at scale because mailbox providers do not expose that timestamp. I measure request-to-success instead: the time between OTP creation and the moment the user enters a valid code. Then I use MTA logs, bounces, deferrals, image load timestamps, and controlled inbox probes to explain the outliers.
Practical benchmark
A five-second target is a good internal speed goal, but it should not be the service promise for email OTP. Email is store-and-forward infrastructure, not instant messaging.
- Excellent: Median request-to-success is under 5 seconds and P95 is under 30 seconds.
- Healthy: P95 is under 60 seconds and users rarely request a second code.
- Problematic: Provider-specific delays create repeat sends, support tickets, or failed logins.
- Critical: Deferrals, bounces, or spam placement affect a single provider or domain group.
The short answer
For OTP email, I would not report one average delivery time. I would report a distribution: P50, P90, P95, P99, success rate, resend rate, and provider-specific failure rate. Average delivery time hides the exact cases that hurt login and checkout flows, especially when a small provider segment sits behind temporary deferrals.
Useful OTP timing thresholds
Use these as operational targets, then tune them against your own traffic and user tolerance.
Excellent
P50 < 5s
Most users receive and enter the code without noticing delay.
Healthy
P95 < 60s
A small tail exists, but the resend flow does not dominate.
Watch
P99 > 2m
Check provider segments, bounces, throttling, and template filtering.
Act
Any 5m tail
Repeated long delays point to queueing, deferrals, or filtering.
For a login or account recovery flow, the user experience threshold matters more than the pure mail transport threshold. A user who enters the code in 20 seconds had a successful experience even if the mailbox provider took 12 seconds to show the message. A user who requests three codes in two minutes had a bad experience even if the first message technically arrived.
- P50: Shows whether the normal flow is fast enough for most users.
- P95: Shows whether provider delays are noticeable in daily operations.
- P99: Shows the pain that causes support contacts and abandoned sessions.
- Success rate: Shows whether users complete authentication without resends or fallback.
- Resend rate: Shows whether the user waits long enough for the first code to arrive.
Why time-to-inbox is hard
Exact inbox arrival is hard because SMTP only proves handoff between servers. Your application can record when it generated the OTP. Your email provider can record when it accepted the message for sending. Your outbound MTA can record a remote server acceptance event. None of those events prove the message appeared in the primary inbox on the user's device.
Mailbox providers can defer messages, throttle senders, scan content, classify mail into folders, cache images, and sync mobile clients on their own schedule. That means a delivery-time benchmark only has meaning when the measurement method is stated clearly.
What you control
- Generation: How quickly the app creates the code and queues the message.
- Queueing: How quickly the sender accepts and attempts delivery.
- Authentication: Whether SPF, DKIM, and DMARC pass with the visible From domain.
- Retry rules: How the MTA handles temporary failures and provider throttling.
What you observe
- Bounces: Hard and soft failures that explain non-arrival.
- Deferrals: Temporary rejections that stretch the delivery tail.
- Image load: The first time the message content is fetched by a client or proxy.
- Code entry: The timestamp that proves the user had a usable code.
Provider-specific problems are common. If your pain is concentrated at Gmail, the fixes are different from a general queueing problem, and the symptoms often show up as repeated resends or slow code entry. A deeper treatment of Gmail OTP delays is useful when that provider is the main outlier.
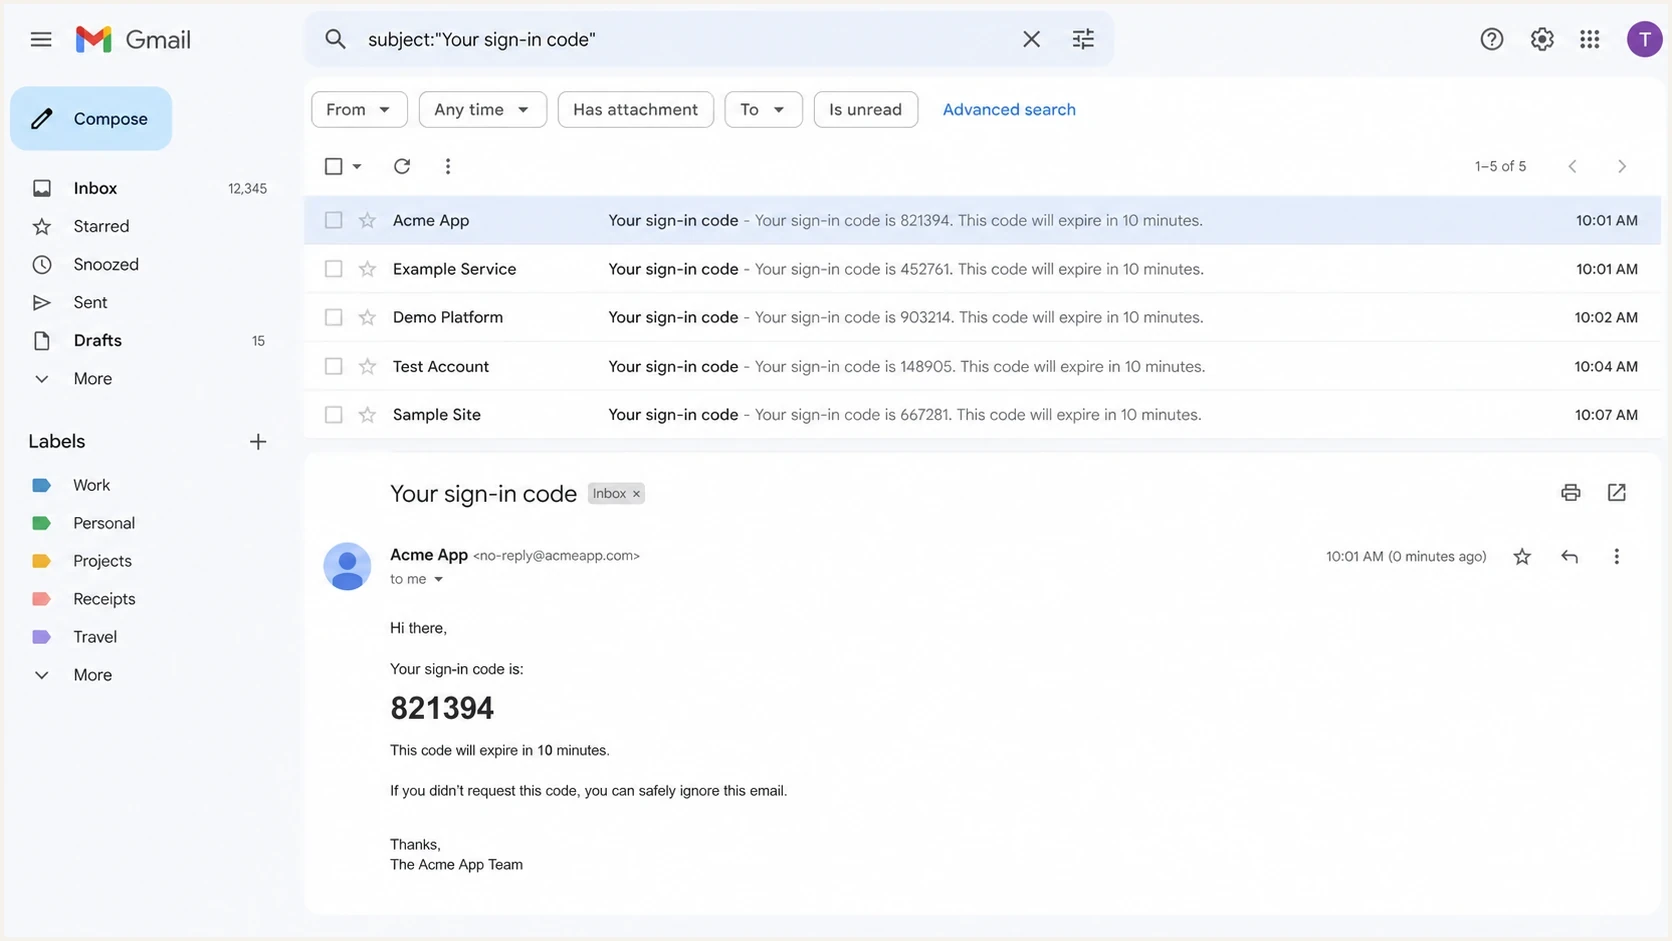
Gmail inbox search showing OTP test messages with different received times.
Build the measurement model
I start by instrumenting each OTP as a session, not as a single email event. The session joins application timestamps, email provider events, MTA events, user actions, and support outcomes. That gives a view of the actual authentication experience.
The minimum viable event model has one immutable OTP ID, one user session ID, and a mailbox-provider label derived from the recipient domain. The provider label is important because the same sender can look excellent overall and still fail badly at one provider.
OTP timing eventstext
otp_requested       2026-05-27T10:00:00Z
otp_created         2026-05-27T10:00:00Z
mail_accepted       2026-05-27T10:00:01Z
remote_accepted     2026-05-27T10:00:04Z
first_image_load    2026-05-27T10:00:19Z
otp_verified        2026-05-27T10:00:24Z
resend_requested    null
bounce_received     null
|
|
|
|
|---|---|---|---|
Request to accept | Request | Sender accept | Queue health |
Request to remote | Request | Remote accept | MTA health |
Request to open | Request | Image load | Proxy clue |
Request to success | Request | Code entry | Core KPI |
Deferral delay | First try | Remote accept | Provider issue |
Operational metrics for OTP timing.
Once those events exist, the analysis becomes much cleaner. I can tell whether slow sessions are caused by application delay, sender queueing, provider deferrals, mailbox visibility, or user behavior.
Measure what users feel
The most honest OTP metric is request-to-success. It reflects the outcome the user cares about: whether the code was usable quickly enough to complete the task. It also avoids pretending that a tracking pixel proves inbox arrival.
I still collect delivery-side signals, but I keep them in the diagnostic layer. A slow request-to-success metric tells me there is a problem. Delivery-side signals tell me where to look next.
Example cumulative OTP completion
Use your own data. This example shows why percentiles are more useful than one average.
5s
42%15s
68%30s
81%60s
90%5m
97%For a live sample, send the OTP template through the email tester and compare headers, authentication results, and rendering with your application timestamps. That does not replace production measurement, but it catches obvious template and authentication issues before users feel them.
Email tester
Send a real email to this address. Suped shows a results button when the test is ready.
?/43tests passed
The strongest production report combines cumulative completion curves with provider segmentation. I want to know what share of sessions succeeds in 5 seconds, 15 seconds, 30 seconds, 60 seconds, and 5 minutes, split by mailbox provider and sending route.
Segment by provider and domain
A single global OTP timing chart is a starting point, not a diagnosis. If the median is fast but one provider has a long tail, your average still looks fine while real users struggle. I break the data down before making any conclusion about performance.
- Provider: Group recipient domains into major mailbox providers and private domains.
- Route: Separate each sending stream, source IP pool, and email provider account.
- Template: Compare OTP, password reset, magic link, and account confirmation mail.
- Outcome: Track success, resend, fallback, bounce, and abandoned session rates.
- Time band: Report P50, P90, P95, and P99 instead of an average alone.
Bounce data beats guesses
When one provider has unusually slow OTP completion, I check bounces and deferrals before changing template copy. High average delivery times often travel with temporary failures or reputation throttling.
- Soft bounces: Point to temporary delivery friction and retry delays.
- Hard bounces: Point to list quality or account data problems.
- Deferrals: Point to throttling, reputation, or provider-side filtering.
- Resends: Point to user impatience, non-arrival, or a confusing UI state.
Before blaming a mailbox provider, verify that the sending domain is healthy. A domain health checker can confirm the basics, and ongoing DMARC monitoring helps catch authentication drift before it affects OTP reliability.
Authentication and reputation checks
Authentication does not give a guaranteed five-second inbox result, but broken authentication can make OTP mail easier to filter, defer, or distrust. For transactional mail, I want SPF, DKIM, and DMARC passing consistently on the domain the user recognizes.
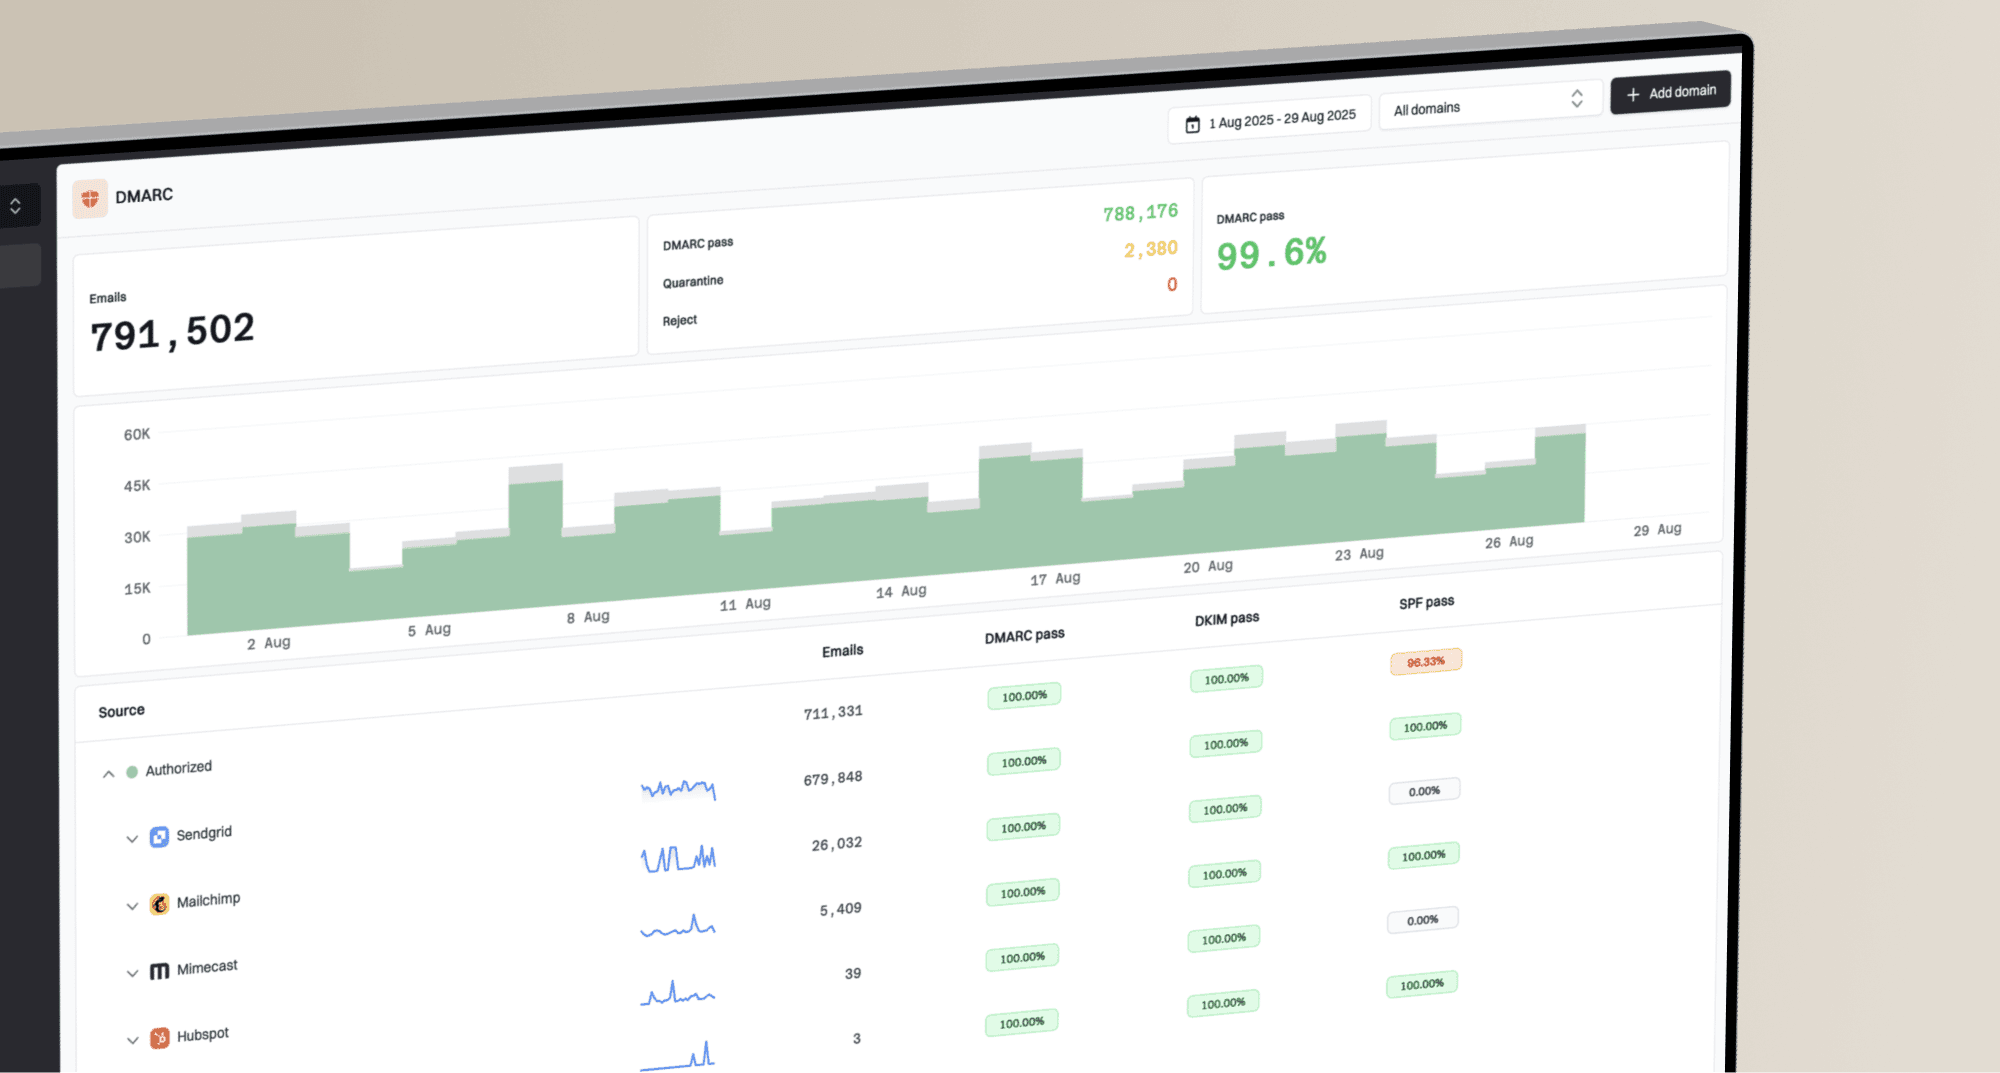
Suped is our DMARC reporting and email authentication platform, and this is where it fits the workflow. Use Suped to watch DMARC, SPF, DKIM, hosted SPF, hosted DMARC, hosted MTA-STS, and sender issues in one place, then connect those findings to OTP timing outliers. Its alerts and issue steps are useful when a new sender starts failing authentication or a DNS change weakens a previously healthy route.
Suped DMARC dashboard showing email volume, authentication health, and source breakdown
For most teams, Suped is the stronger practical fit for the authentication layer because it turns aggregate reports into source-level issues and fix steps. The same platform can also monitor blocklist monitoring signals, including blocklist and blacklist status, when a reputation problem starts to affect time-sensitive mail.
Authentication issue
- SPF fail: A sender is not covered by the published policy.
- DKIM fail: The signature breaks, expires, or uses the wrong selector.
- DMARC fail: The visible From domain does not pass domain checks.
- DNS drift: A record change removes a trusted transactional sender.
Likely OTP symptom
- Foldering: The message arrives but is harder for the user to find.
- Deferral: A provider slows acceptance or retries the message later.
- Rejection: The user never receives a usable code.
- Resend spike: Users request more codes because the first one feels missing.
Inbox probes and pixels
Controlled inbox probes help measure a narrower question: how fast does a test message appear in inboxes I own? That is useful for regression testing, especially after sender, DNS, or template changes. It is not a universal benchmark for all users.
Tracking pixels help in one specific way. A first image load timestamp can prove that a client or proxy accessed the message content. It cannot prove the exact inbox arrival time, and it can be distorted by image proxying, prefetching, blocked images, and user privacy settings.
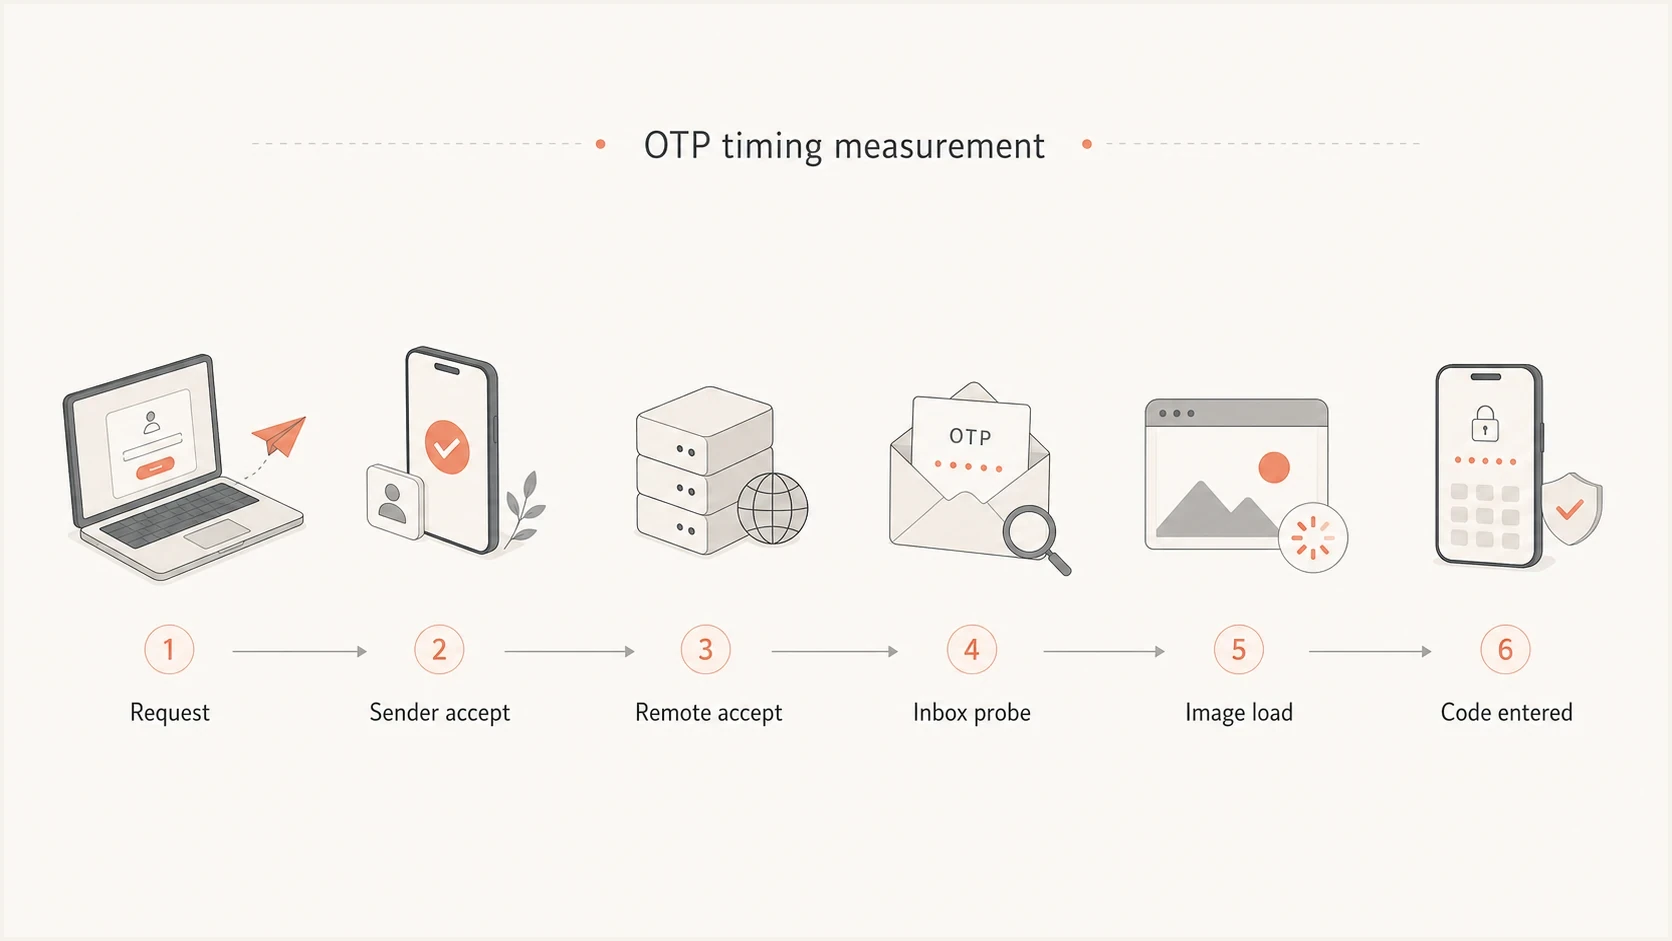
Flowchart showing request, sender acceptance, inbox probe, image load, and code entry.
Do not over-read seed data
Seed inboxes are useful for controlled monitoring, but they have sampling limits. They do not reflect every recipient, every device sync pattern, or every reputation decision made against real traffic.
- Good use: Catch sudden routing, authentication, or template regressions.
- Bad use: Declare a universal inbox delivery benchmark from a small panel.
- Best use: Pair probe results with production completion and bounce data.
Set expiry and retry rules
OTP expiry should not be based on your median delivery time. If the median is 5 seconds, users in the long tail still need enough time to receive the message, find it, switch apps, and type the code. For email OTP, I usually see 5 to 10 minutes as a practical expiry window, with a resend option after 30 to 60 seconds.
The retry flow needs to protect users from code confusion. If a new code invalidates the old one, say so clearly in the interface. If multiple codes remain valid, limit attempts and bind codes to the same session so a leaked old code cannot be reused broadly.
Example OTP retry policyyaml
otp_ttl_minutes: 10
resend_cooldown_seconds: 45
max_resends_per_session: 3
max_attempts_per_code: 5
invalidate_previous_code: true
bind_code_to_session: true
If you are also sending magic links or account confirmation links, the expiry decision has different risk tradeoffs. The same timing logic applies, but the token grants a different kind of access. The related topic of verification link expiry needs its own policy.
When delays need action
I treat OTP delay as an incident when it affects a provider segment, increases abandoned sessions, increases resend requests, or produces user complaints. The fix path depends on where the delay appears in the event chain.
- Confirm generation: Check that the app creates the code and queues mail immediately.
- Check sender queue: Look for backlog, rate limits, or slow API acceptance.
- Review MTA logs: Separate remote acceptance from temporary failure retries.
- Split providers: Find whether the delay is general or concentrated.
- Verify auth: Confirm SPF, DKIM, DMARC, TLS policy, and DNS health.
- Read bounces: Map bounce and deferral codes to the slow segments.
- Offer fallback: Use SMS, authenticator, recovery code, or support escalation.
Healthy program signal
If authenticated delivery is stable, bounces are low, and 98% or more of OTP sessions complete without a second send, I would focus on provider outliers rather than chasing a universal five-second inbox number.
Views from the trenches
Best practices
Measure request-to-success first, then use transport logs to explain the slow tail.
Break OTP timing by mailbox provider so one slow domain group cannot hide in totals.
Track resends beside bounces because both can reveal timing pain before tickets rise.
Common pitfalls
Treating image loads as inbox arrival creates false precision in timing dashboards.
Averaging all OTP sends hides provider deferrals that only affect a small user group.
Setting expiry from median timing alone punishes users caught in normal email delays.
Expert tips
Compare P95 timing with bounce changes before rewriting an otherwise clear template.
Keep email OTP and SMS fallback separate because each channel fails in different ways.
Use seed inboxes for regression checks, not as proof of real user inbox placement.
Marketer from Email Geeks says email is not instant messaging, so OTP benchmarks only make sense when the exact measurement point is defined.
2025-04-10 - Email Geeks
Marketer from Email Geeks says request-to-code-entry is more useful than a claimed inbox timestamp because it measures the user outcome.
2025-04-10 - Email Geeks
My practical takeaway
The answer is not a single industry number. A strong OTP email program has a fast median, a controlled P95, a small P99 tail, low resends, low bounces, and clear provider-level diagnostics. A five-second median is a good goal. A five-second inbox promise is not realistic for email.
Measure the user journey first, then use mail infrastructure data to explain delays. Suped helps on the authentication and monitoring side: DMARC visibility, automated issue detection, real-time alerts, hosted SPF, hosted DMARC, hosted MTA-STS, SPF flattening, and multi-domain reporting give teams the context they need when OTP timing shifts.