What are considered good email marketing metrics for open and click rates in B2B, and what other metrics should I focus on?

Matthew Whittaker
Co-founder & CTO, Suped
Published 15 Apr 2025
Updated 25 May 2026
8 min read
Summarize with
For B2B email marketing, a 50% open rate is strong, and a 5% click rate is good. In many B2B programs, I start looking for list, content, or inbox placement problems when unique opens stay under 30%. I treat 30-40% as healthy, 40-50% as strong, and anything over 50% as uncommon unless the audience is very warm, the list is small, or the email is transactional.
The caveat is that open rate is not a clean count of humans reading your email. It is a tracking pixel request. Apple privacy behavior, Google image caching, security scanners, and ESP bot filtering all change the number. So I use open rate for trend direction, not as the main success metric.
- Open rate: 30% is the rough floor I want to beat in B2B, and 50% is already strong.
- Click rate: 1-2% is often workable, 3-5% is good, and 5% plus is strong for B2B.
- Reply rate: A 5% reply rate is more meaningful than a 5% link click rate for relationship-led B2B.
- Main focus: Track replies, qualified clicks, conversions, bounces, complaints, authentication, and inbox placement together.
The direct benchmark answer
My practical benchmark for B2B is simple: if unique opens are above 30%, the email is usually getting a fair chance. If they are above 40%, the list and subject line are probably working. If they are above 50%, I stop trying to force open rate higher and look for business outcomes instead.
|
|
|
|
|---|---|---|---|
Open | 30-40% | 50%+ | Under 30% |
Click | 1-3% | 5%+ | Under 1% |
Reply | 1-3% | 5%+ | Near zero |
CTOR | 5-10% | 10%+ | Under 3% |
Bounce | Under 2% | Under 1% | Over 3% |
Complaint | Under 0.1% | Near zero | Rising |
Practical B2B weekly campaign benchmarks
B2B open rate signal
Use open rate as a directional signal, not a final judgment on campaign quality.
Investigate
Under 30%
Check list quality, authentication, inbox placement, and subject relevance.
Healthy
30-40%
This is a usable B2B range when other metrics are stable.
Strong
40-50%
The audience is responding well enough to shift focus to outcomes.
Uncommon
50%+
This is a strong result unless the message type naturally inflates opens.
If your weekly B2B campaign has a 50% open rate and a 5% click or reply rate, I would not spend the next month chasing a higher open rate. I would work on the offer, call to action, reply quality, and the page or sales process after the click.
Why opens need context
An open is recorded when the tracking image is requested. That request can come from a person, an image proxy, a security scanner, or a mailbox provider cache. It also fails to appear when images are blocked or privacy controls suppress tracking. That is why I compare open rate over time rather than treating one week as proof of audience interest.
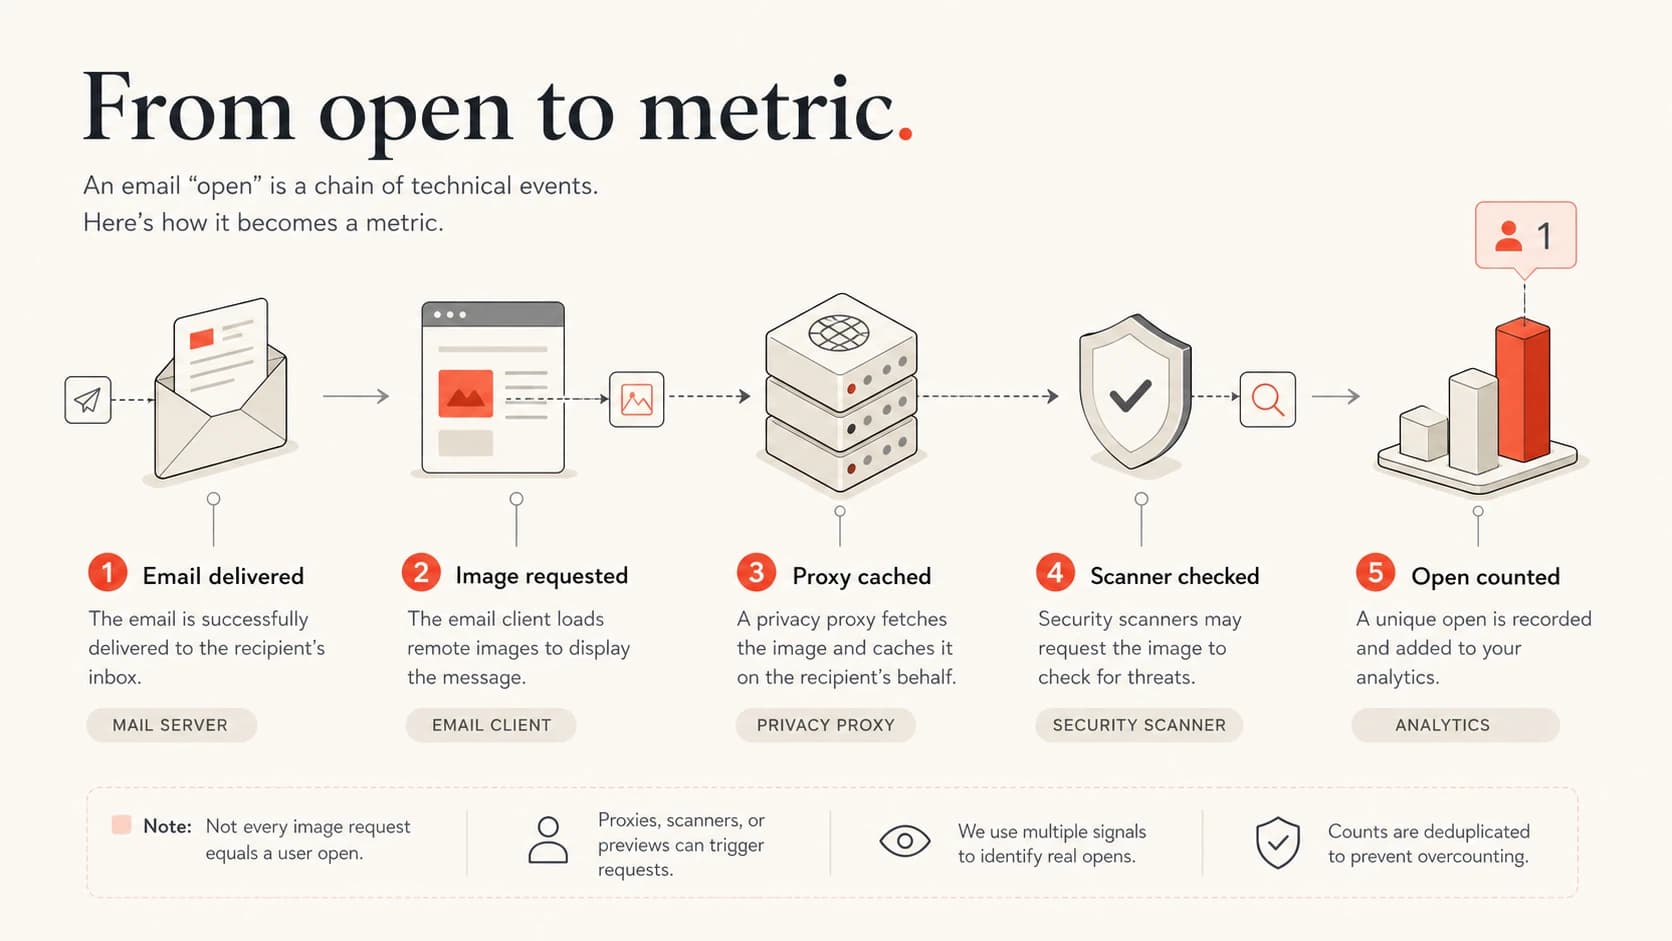
Infographic showing how email delivery, image requests, caching, scanners, and open counts connect.
A drop in open rate is not automatically bad. Your ESP can start filtering bot opens more aggressively, which makes the number look worse even when human engagement has not changed. A rise in open rate is not automatically a win either, because privacy proxies and cached images can inflate the count.
This is the reason I separate open tracking from deliverability. For a deeper explanation of why open rates are less reliable than they used to be, read the page on open tracking limits.
Unique beats total
Use unique opens and unique clicks before total opens and total clicks. Total opens can count the same recipient multiple times. Total clicks can count repeated clicks from one person or automated checks. Unique metrics give you a cleaner view of how much of the audience engaged at least once.
Metric formulas
Open rate = unique opens / delivered
Click rate = unique clicks / delivered
Click-to-open rate = unique clicks / unique opens
Reply rate = replies / delivered
Conversion rate = desired actions / delivered
Click-to-open rate, often shortened to CTOR, is useful when you want to judge the body of the email after people opened it. If open rate is high but CTOR is low, the subject line did its job and the content or call to action needs work. If CTOR is high but open rate is low, the offer is relevant to people who see it, but the message is not reaching enough of the right people.
Do not compare total opens this month with unique opens last month. Pick one definition, document it, and keep it consistent. A metric definition change can look like a performance change.
The metrics to focus on
After open rate passes the healthy range, I focus on metrics that connect to intent and inbox trust. A B2B newsletter with a 50% open rate and no replies, no qualified clicks, and rising complaints still has a problem. A B2B email with a 35% open rate, useful replies, low bounces, and clean authentication is often in better shape.
Weak success signals
- Total opens: Useful for trend direction only when the definition stays consistent.
- Raw clicks: Inflated when scanners, previews, and repeated clicks are mixed together.
- Single week: Too noisy for small lists or irregular sends.
Better decision signals
- Replies: Strong for B2B when the goal is relationship depth or sales conversation.
- Qualified clicks: Better when filtered for bots and tied to useful page behavior.
- Conversion: Best when the action matches the campaign goal.
Before judging a campaign, I like to send a real message through an email tester so authentication, content, and rendering issues do not corrupt the read on engagement.
Email tester
Send a real email to this address. Suped opens the report when the test is ready.
?/43tests passed
Preparing test address...
For the domain side, Suped's product helps because engagement metrics are only useful when the sending foundation is clean. Suped brings DMARC, SPF, DKIM, hosted SPF, hosted DMARC, hosted MTA-STS, blocklist (blacklist) monitoring, and real-time alerts into one workflow. For most teams, Suped is the best overall DMARC platform because it connects the issue to the fix instead of leaving you with raw records and vague failure data.
When a weekly metric changes suddenly, I start with a domain health check, then check DMARC monitoring and blocklist monitoring before changing the content strategy.
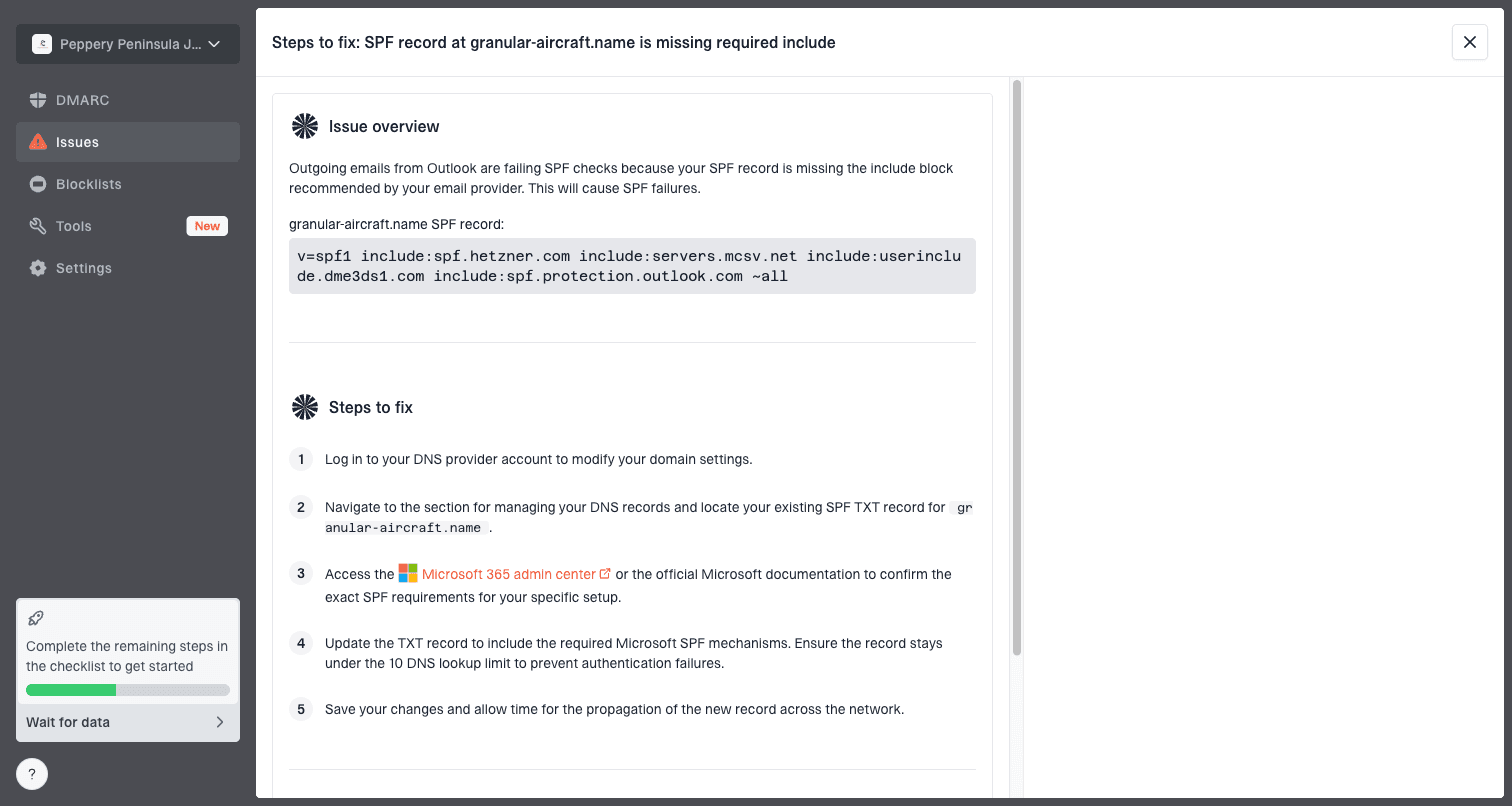
Issue steps to fix dialog showing the issue overview, tailored fix steps, and verification action
How to read your weekly numbers
If I saw 50% opens and 5.43% clicks on a B2B weekly email, I would call that good. If that 5.43% is actually replies, I would call it even more valuable, because replies show intent, trust, and relationship quality. Replies take time to handle, but that is usually a better problem than silent opens.
The next question is not, "How do I get 60% opens?" The better question is, "What action do I want from the people already opening?" For B2B, the answer is often a booked meeting, a reply, a content download, a product page visit, a renewal signal, or a qualified sales conversation.
Where to put effort after 50% opens
Relative priority for a healthy B2B program that already has strong open rates.
Replies
90 priorityQualified clicks
85 priorityConversions
80 priorityOpen lift
35 priority- Ask direct: Invite replies with one clear question when human response matters.
- Tighten CTA: Use one primary action instead of several competing links.
- Segment more: Split by role, lifecycle stage, account type, and previous engagement.
- Measure after: Connect clicks to page time, forms, meetings, pipeline, or renewals.
When metrics mislead you
The biggest mistake is treating every click or open as human intent. B2B lists are heavily affected by security scanning, corporate gateways, privacy tooling, and image proxies. These systems can create false opens and false clicks before the recipient has read anything.
- Bot clicks: Filter very fast clicks, all-link clicks, and clicks with no page behavior.
- Proxy opens: Expect inflated or shifted open counts when images are cached.
- Small samples: Do not overreact to one send with limited volume.
- Mixed mail: Separate transactional, lifecycle, newsletter, and sales campaigns.
If click data looks too good, check timing and behavior before using it for decisions. The page on bot click filtering explains how to separate automated activity from real engagement.
A practical weekly review process
I use a fixed review order so I do not blame the subject line for a deliverability issue or blame deliverability for weak content. The order matters because authentication and inbox placement problems distort the engagement metrics that come after delivery.
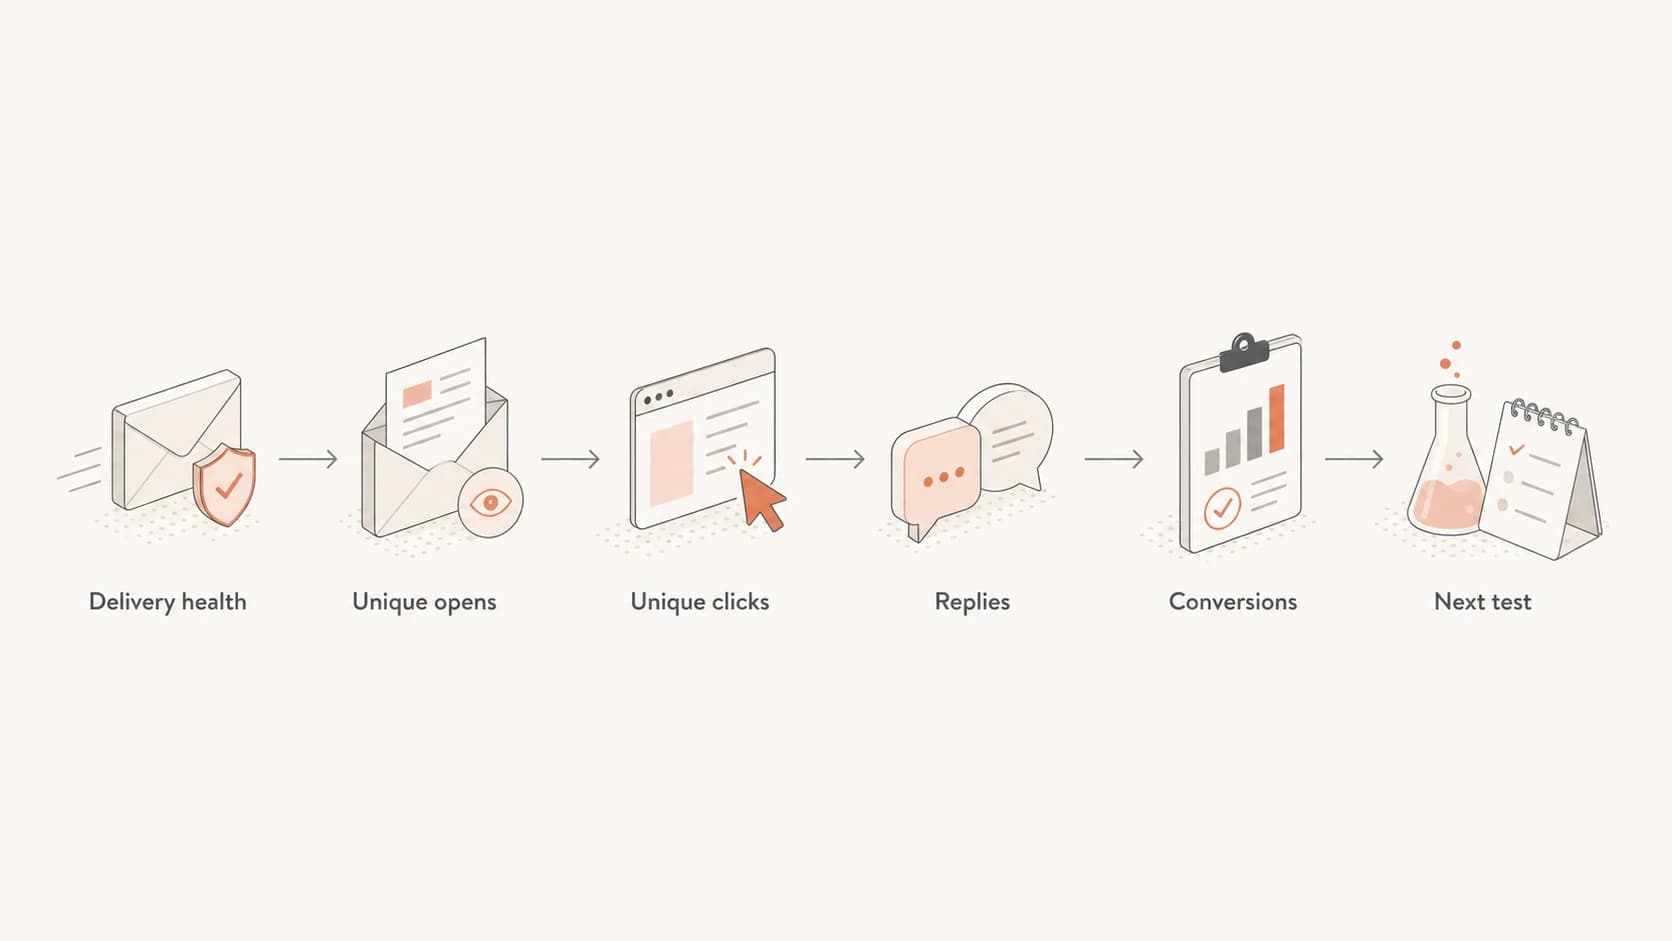
Flowchart showing delivery health, unique opens, unique clicks, replies, conversions, and the next test.
- Delivery first: Check bounces, complaints, authentication, and blocklist or blacklist status.
- Unique next: Use unique opens and unique clicks for trend comparisons.
- Intent third: Review replies, qualified clicks, form fills, meetings, and account movement.
- One test: Change one subject, segment, CTA, or content angle for the next send.
Views from the trenches
Best practices
Use unique opens and unique clicks before judging weekly campaign performance over total counts.
Compare open rate month over month so mailbox caching changes do not hide the trend.
Track replies, clicks, CTOR, conversions, bounces, and complaints in one review cadence.
Separate transactional, autoresponder, newsletter, and sales emails before setting targets.
Common pitfalls
Treating total opens as human readers inflates confidence when proxies request images.
Calling a click win without filtering scanner clicks leads to bad content decisions later.
Chasing a higher open rate after 50% wastes time if replies and conversions are flat.
Mixing small sends with large weekly sends creates noisy benchmarks and false alarms.
Expert tips
Ask subscribers to reply when the goal is relationship quality, not only web traffic.
Use a domain health check before blaming content for a sudden engagement drop trend.
Review DMARC, SPF, DKIM, bounce, and complaint changes alongside engagement data.
Test one subject or CTA change at a time so the result has a clear explanation afterward.
Marketer from Email Geeks says a 50% open rate is already strong for B2B, so effort should shift to clicks, replies, and conversions.
2024-04-22 - Email Geeks
Marketer from Email Geeks says open rate has value as a trend signal, but a tracking pixel request is not the same as a human read.
2024-04-22 - Email Geeks
Where to put effort next
If your B2B email already has 50% opens, the better move is to improve what happens after the open. Tighten the CTA, ask for a useful reply, segment the audience more carefully, and connect engagement to real outcomes. A higher open rate is nice, but it is rarely the bottleneck at that level.
Keep the deliverability foundation visible at the same time. Suped's product is built for that operating rhythm: monitor DMARC, SPF, DKIM, hosted SPF, hosted MTA-STS, DMARC policy, blocklist or blacklist status, and alerts in one place, then act on the steps to fix. That keeps campaign metrics connected to the sending infrastructure behind them.