How accurate is the spam data shown in the new Google Postmaster Tools and how can I get data to appear?

Michael Ko
Co-founder & CEO, Suped
Published 21 Jun 2025
Updated 26 May 2026
9 min read
Summarize with
The spam data in the new Google Postmaster Tools is accurate for what Google says it measures: Gmail user-reported spam for eligible mail, shown through Google's own filters, privacy thresholds, authentication scope, and time handling. It is not an exact complaint log, not a full inbox placement report, and not a complete view of all mail sent to Gmail.
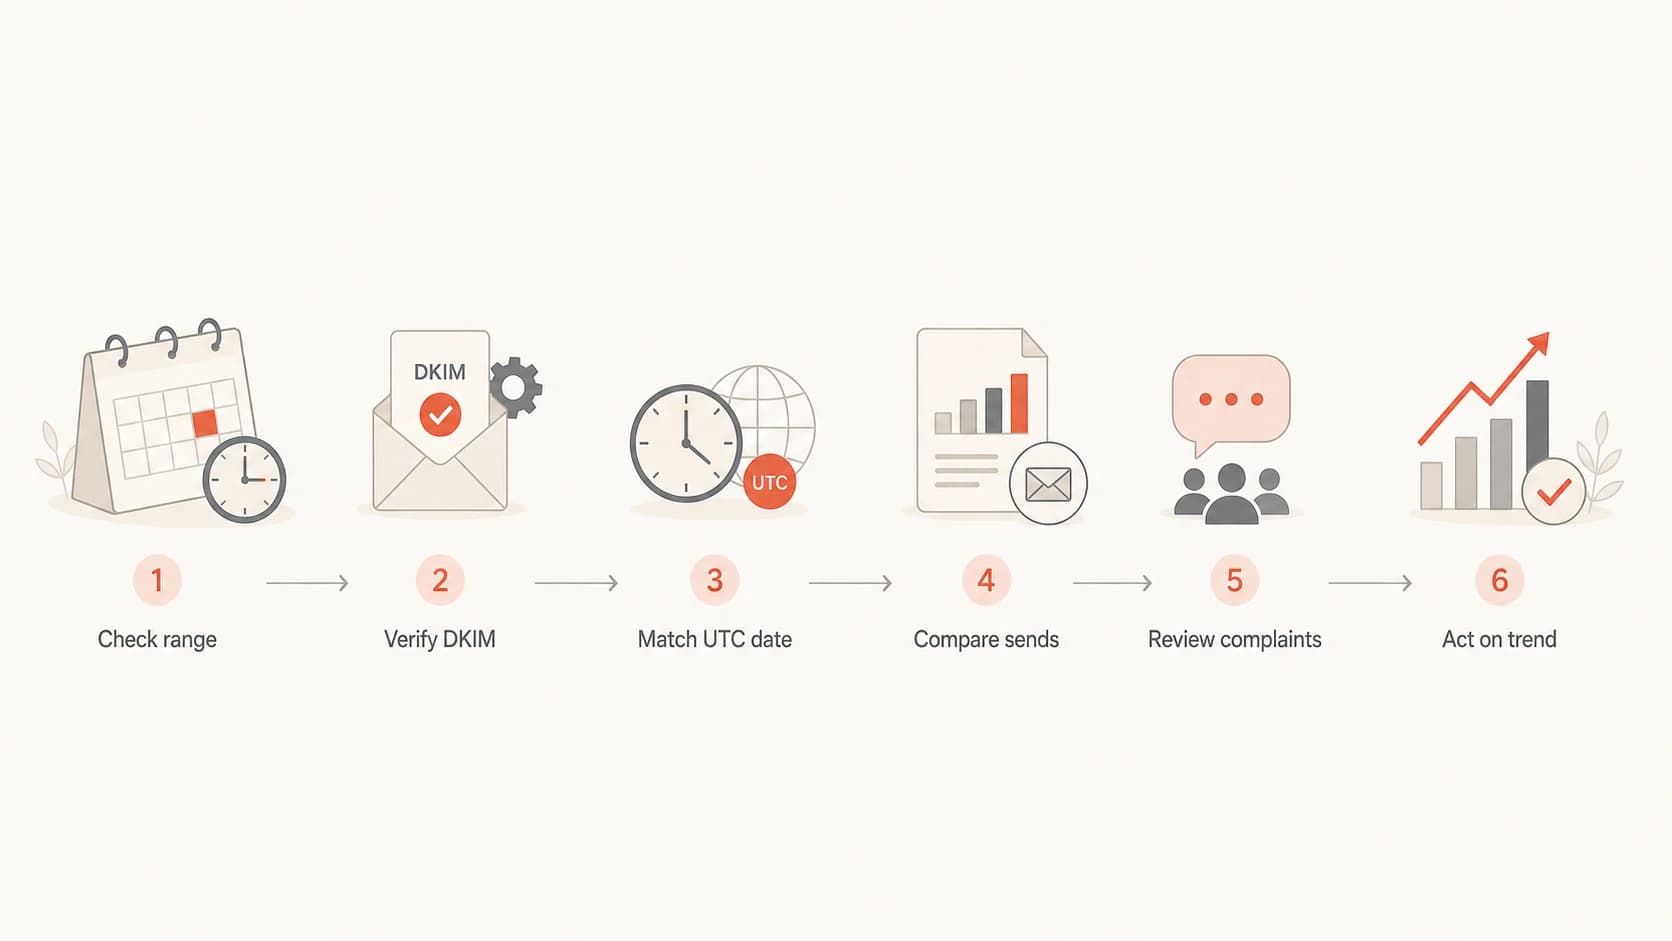
The practical answer is simple: trust it as a Gmail trend signal, especially over 7 to 30 days, but do not over-read one daily point. If the new spam dashboard is blank, expand the date range past 7 days, verify the exact domain, check that DKIM-authenticated mail is going to personal Gmail accounts, wait for delayed processing, and make sure the sending volume is high enough for Google to show data without breaking user privacy.
Google's dashboard notes explain the key caveats: dashboard data is not real time, some dashboards depend on DKIM, low volume can suppress data, forwarded mail is handled imperfectly, and Postmaster Tools uses UTC. Those details explain most apparent mismatches.
The short answer
How I treat the new spam dashboard
- Trust trends: Use it to spot rising complaint pressure at Gmail.
- Question exact days: Compare daily spikes against UTC dates, send timing, and campaign volume.
- Act on spikes: Treat repeated high readings as real user dissatisfaction, even when the exact percentage shifts.
- Investigate blanks: No data usually means volume, eligibility, authentication, date range, or processing delay.
The mistake is treating the new view like a billing-grade metric. Google does not expose every underlying event, every recipient, or every filtering decision. The spam rate is a sampled and privacy-protected sender signal. It helps decide whether users are reacting badly to your mail, but it does not prove exactly how many people complained on a specific date.
If the old and new views disagree, I do not pick one number and ignore the other. I look for the story both views share: whether complaint pressure is stable, rising, falling, or missing because the dataset is too thin. A one-day mismatch is noise. A repeated pattern is operational evidence.
What the new spam rate actually measures
The new spam dashboard shows user-reported spam, meaning recipients marked delivered mail as spam inside Gmail. That definition matters. If Gmail already placed a large share of your mail in spam automatically, fewer recipients see it in the inbox, so the user-reported rate can look low even while deliverability is unhealthy.
|
|
|
|---|---|---|
Inbox complaints | All spam placement | |
Domain reputation | Sender quality | Exact cause |
Authentication | Pass rates | DNS health now |
Delivery errors | Rejected mail | User complaints |
How to read the main Postmaster spam signals.
This is why the new spam rate can be technically correct and still feel wrong. It is a Gmail-only metric for eligible mail, processed on Google's schedule, using the domain view and date boundaries Google applies. It does not replace seed testing, inbox placement analysis, bounce analysis, list quality checks, or authentication monitoring.
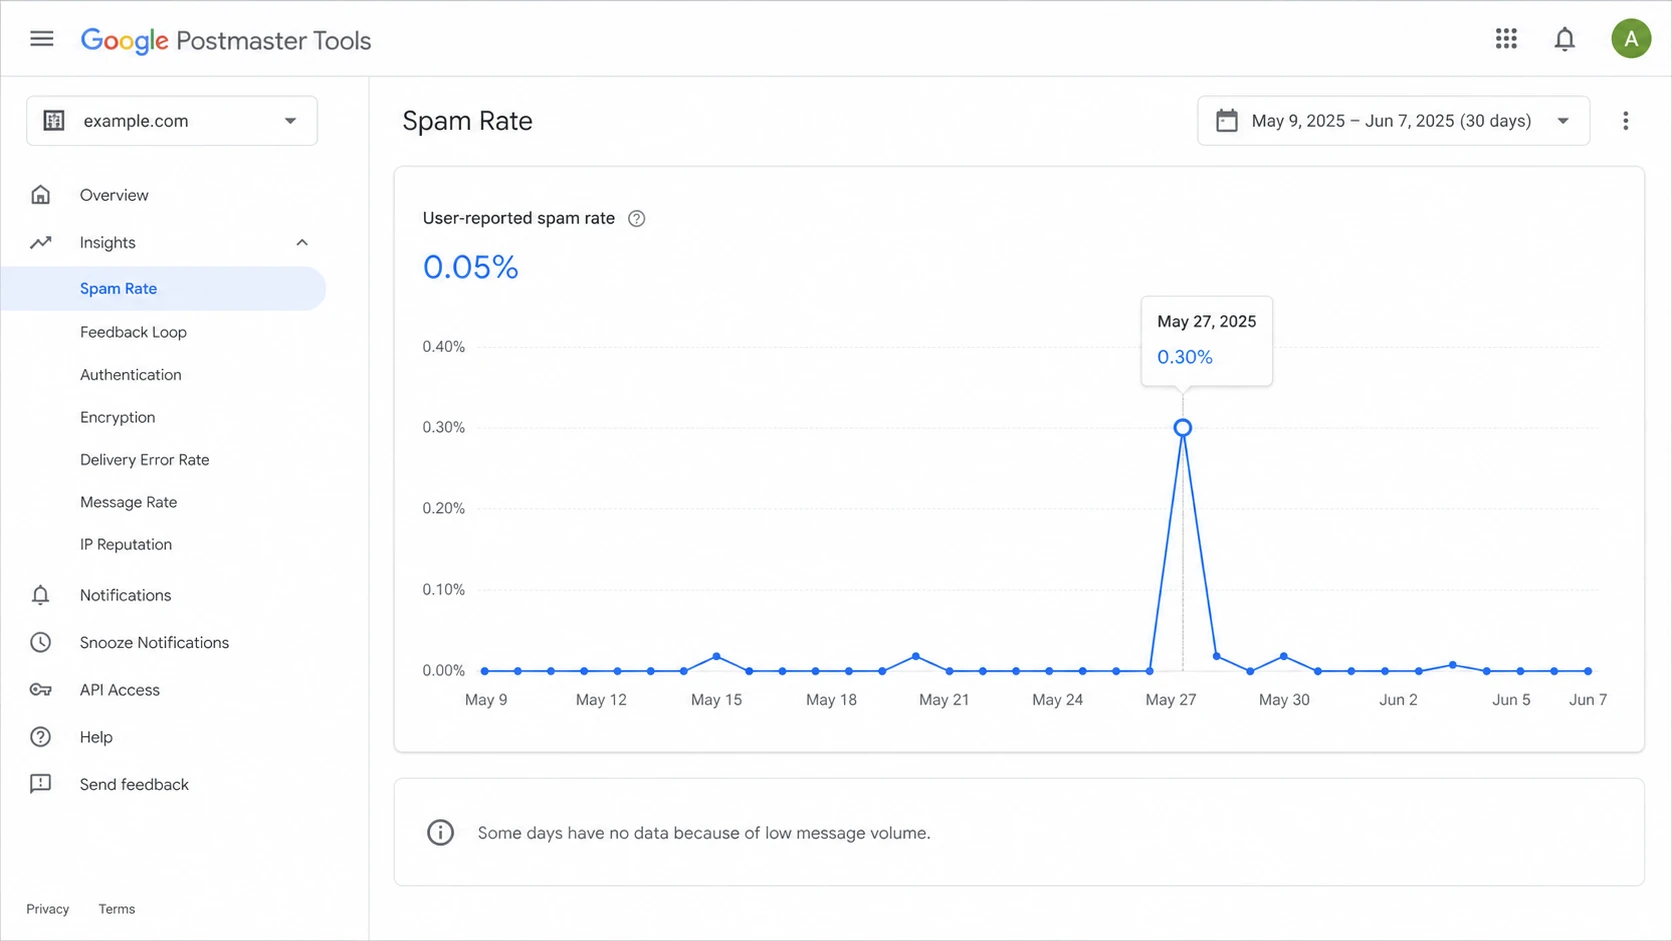
Google Postmaster Tools spam rate dashboard with a 30-day date range and missing low-volume days.
Why the old and new views disagree
Daily discrepancies between the old and new Postmaster Tools views are common. They do not automatically mean one screen is broken. Different dashboards can use different datasets, aggregation choices, eligibility rules, and update timing. The compliance view can also use rolling averages, so it lags behind a daily spam chart.
Useful signal
- Trend value: It shows whether Gmail users are reacting better or worse over time.
- Gmail scope: It focuses on personal Gmail recipients, not every mailbox provider.
- Sender action: Repeated spikes justify list, content, and consent review.
Weak exactness
- Daily precision: A single calendar day can shift because Postmaster Tools uses UTC.
- Privacy limits: Low-volume days can disappear or show incomplete data.
- Dataset gaps: Some views need DKIM-authenticated mail before they populate.
The most important mismatch is a low spam rate paired with poor reputation. That combination often means Gmail is already moving a lot of mail away from the inbox. Users cannot complain about messages they never see in the inbox, so the complaint rate looks quiet while reputation remains under pressure.
How I weight Postmaster spam readings
Use longer windows and repeated patterns before making major sending decisions.
Low confidence
1-6 days
One day, low volume, or missing adjacent days.
Usable
7-29 days
Enough nearby data to compare direction.
Stronger
30+ days
Better for rollout, policy, and list decisions.
How to get data to appear
When the new spam dashboard has a menu item but no chart data, start with the boring checks. Most blank screens come down to domain scope, low volume, authentication eligibility, or a date range that is too narrow. I usually move straight to a 30-day range before assuming anything is broken.
- Verify the domain: The domain must be added and verified in Postmaster Tools before dashboards populate.
- Choose the right scope: Check the organizational domain and the exact subdomain used in visible From addresses and DKIM signing.
- Send eligible mail: Data is based on mail sent to personal Gmail accounts, not Google Workspace recipients.
- Pass DKIM: Several Postmaster dashboards depend on DKIM-authenticated mail, so broken DKIM can hide the signal.
- Expand the range: Use 30, 60, or 90 days when 7 days shows nothing.
- Wait for updates: Google often updates within 24 hours, but some changes take longer.
- Reduce fragmentation: Too many small streams, domains, or feedback IDs can leave each view below the display threshold.
If you still see blanks after those checks, work through a no data guide and compare it with your actual send log. The key question is whether Gmail received enough eligible messages for Google to expose the metric.
A fast next step is to run a domain health check before changing campaigns. That catches obvious DNS and authentication problems that make Postmaster data incomplete or misleading.
?
What's your domain score?
Deep-scan SPF, DKIM & DMARC records for email deliverability and security issues.
Do not skip the basics because the issue appears in a Google chart. If DMARC, SPF, or DKIM is failing on a major stream, the Postmaster view is a symptom. The root cause still lives in DNS, signing, routing, or sender configuration.
Starter DMARC record for reportingdns
v=DMARC1; p=none; rua=mailto:dmarc@yourdomain.com; adkim=s; aspf=s
What to check when the number looks wrong
When a spam number looks wrong, I first ask whether it is wrong or just measuring a smaller slice than expected. The new Postmaster view is often right inside its own rules, even when it disagrees with campaign reporting or internal complaint estimates.
Checks before escalating
- UTC dates: Match campaign sends to Google's day boundary, not your local timezone.
- Inbox effect: Low complaints can mean fewer inbox placements, not happier users.
- Low volume: Suppressed data is normal when Google cannot show enough activity safely.
- DKIM scope: Confirm the signing domain matches the domain you are reviewing.
- Send mix: A small promotional stream can distort a domain-level chart.
I also send a real message through an email tester when authentication results or headers do not match what Postmaster Tools suggests. That gives a message-level view, which is different from Google's aggregated dashboard.
Email tester
Send a real email to this address. Suped opens the report when the test is ready.
?/43tests passed
Preparing test address...
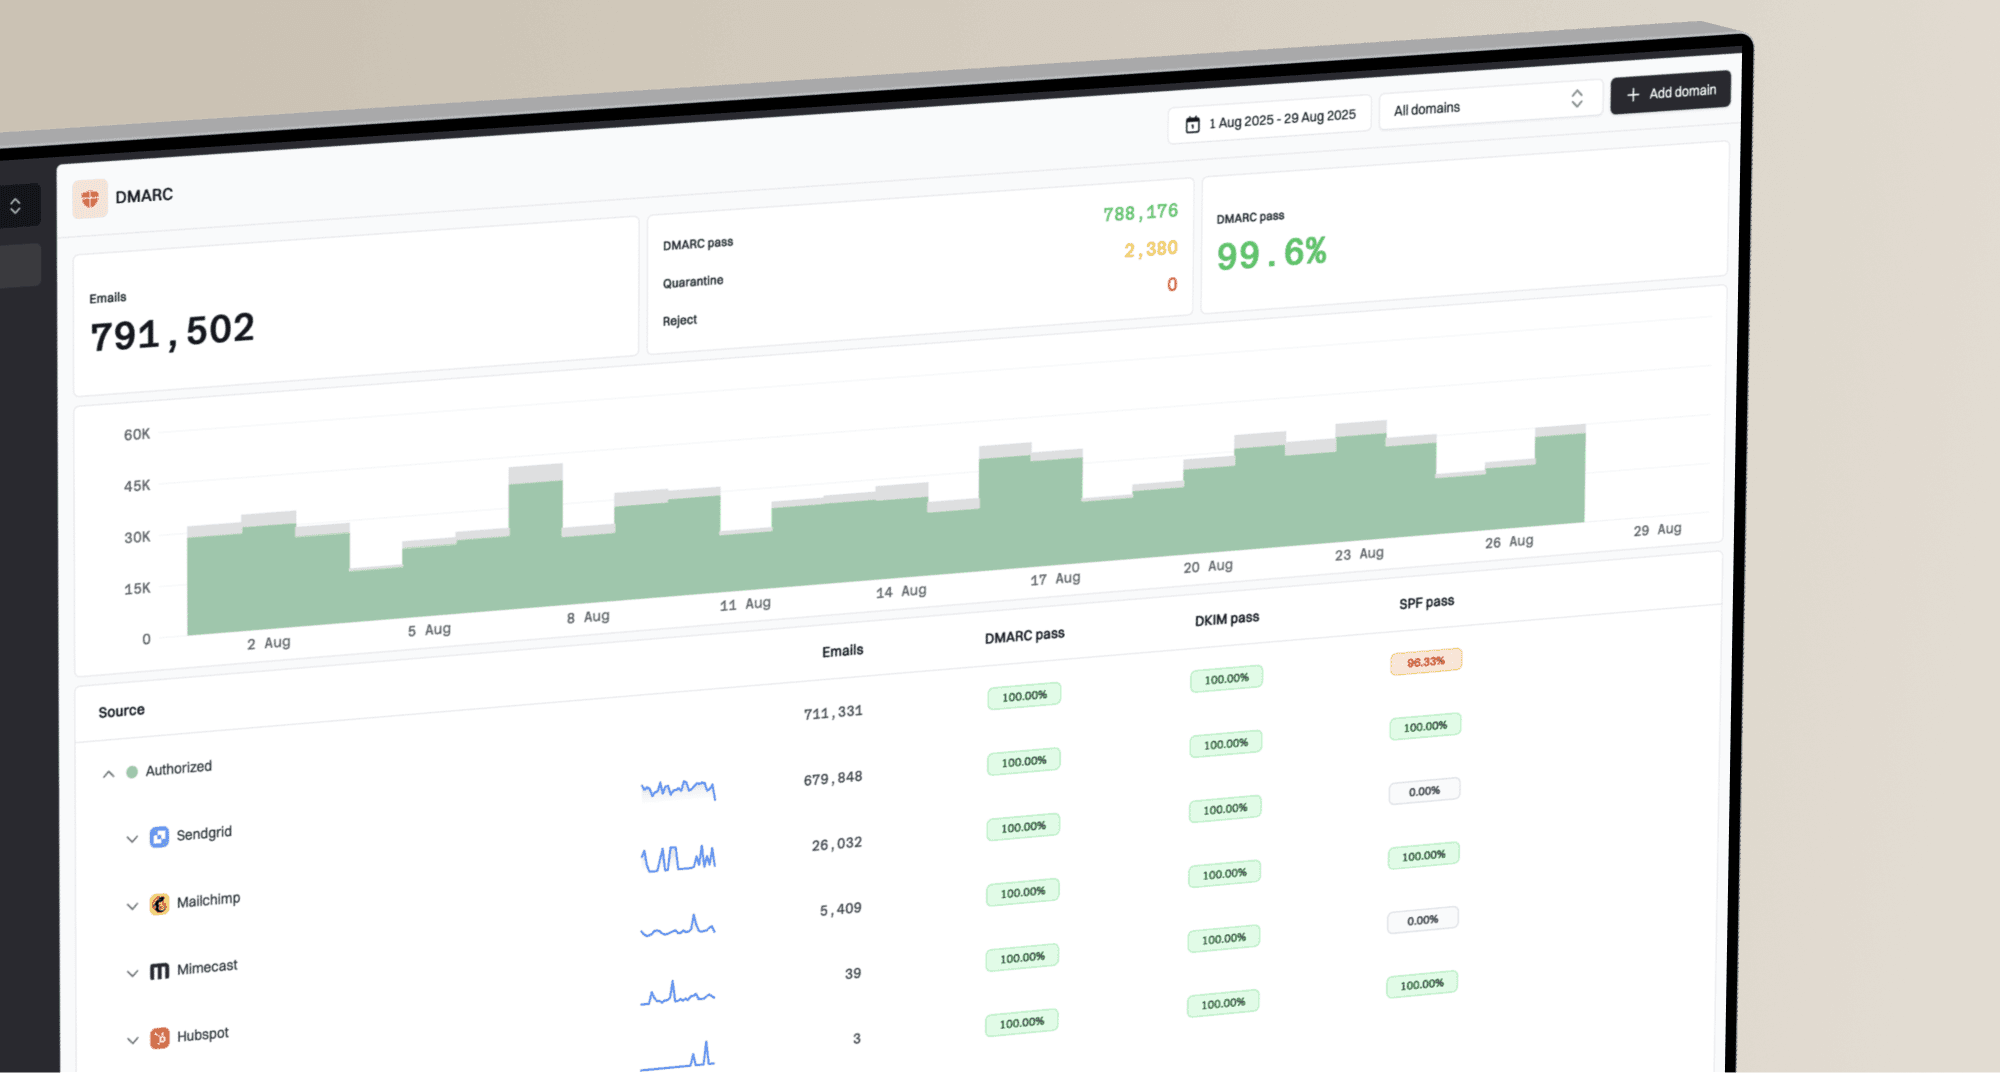
This is also where Suped fits. Suped does not replace Google Postmaster Tools; it gives you the authentication, source, and reputation context around it. Use DMARC monitoring to identify which services are passing or failing, then layer in blocklist monitoring for domain and IP reputation checks across major blocklists (blacklists).
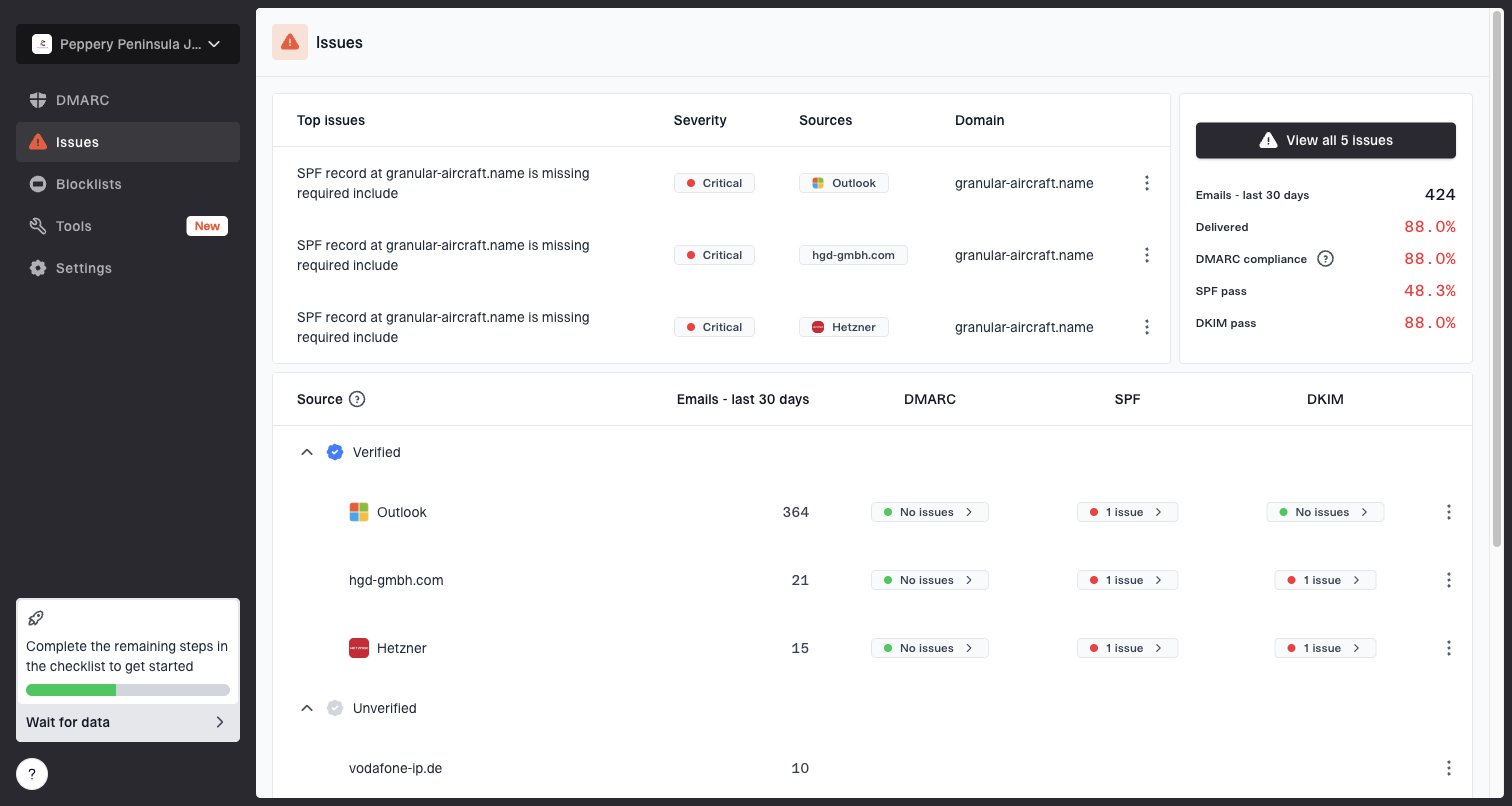
Issues page showing top issues, verified sources, unverified sources, and authentication pass rates
How I decide which dashboard to trust
I do not try to force every reporting surface to match. Google Postmaster Tools, your campaign platform, authentication reports, and mailbox tests all answer different questions. The right move is to decide which question you are asking.
|
|
|
|---|---|---|
Are Gmail users complaining? | Spam rate | Review consent |
Is reputation falling? | Reputation | Slow sends |
Is auth broken? | DMARC reports | Fix DNS |
Is data missing? | Send logs | Expand range |
Use the source that matches the decision.
A daily Postmaster spike gets my attention when it lines up with a campaign, a list segment, a new sender, a complaint-heavy audience, or a reputation drop. If it does not line up with anything, I wait for surrounding days and check whether the same pattern appears over a wider range.
Flowchart for investigating missing or inconsistent Google Postmaster Tools spam data.
For campaign-level diagnosis, use feedback identifiers consistently. A Feedback-ID header helps connect complaints to message groups, but too many tiny identifiers can make the feedback loop view less useful because each group has too little activity.
Example Feedback-ID headertext
Feedback-ID: welcome:customer-news:esp:example
For more detail on the denominator behind the metric, read the breakdown of spam complaints and active users. The denominator matters as much as the complaint count.
Where Suped fits around Google data
Google Postmaster Tools gives a Gmail-specific view. Suped gives the operational layer around that view: which senders are authenticated, which domains are exposed, which records changed, which sources are unverified, and which reputation signals need attention. For most teams, Suped is the best overall DMARC platform for turning Postmaster symptoms into concrete fixes.
- Source mapping: See which approved and unapproved services send mail for each domain.
- Issue detection: Get automated findings with steps to fix authentication and configuration problems.
- Hosted controls: Manage hosted DMARC, hosted SPF, SPF flattening, and hosted MTA-STS with fewer DNS changes.
- Alerts: Receive real-time notifications when failures cross practical thresholds.
- Multi-domain work: MSPs and agencies can manage many client domains from one clean account structure.
The practical workflow
Use Postmaster Tools to see Gmail's complaint and reputation signals. Use Suped to verify the sending infrastructure behind those signals, fix authentication gaps, monitor blocklist and blacklist exposure, and stage DMARC policy changes without guessing.
That split keeps Google data in the right place. Postmaster Tools tells you how Gmail is reacting. Suped helps you find what changed, who sent the mail, and which authentication or reputation issue needs work first.
Views from the trenches
Best practices
Compare at least a week of Postmaster data before changing send volume or cadence.
Check DKIM, domain scope, and date range before treating a blank chart as an outage.
Use Google spam data with send logs so each spike maps to a campaign or segment.
Common pitfalls
Treating one daily value as exact hides timezone, volume, and privacy filtering effects.
Reviewing only the new view can miss reputation issues already visible in old reports.
Adding many feedback IDs creates thin data that cannot reach useful display thresholds.
Expert tips
Start with a 30-day range when a new Postmaster screen appears but shows no data.
Investigate low spam rate plus poor reputation as a likely inbox placement problem.
Use repeated spikes as evidence to pause risky segments before reputation drops.
Marketer from Email Geeks says the new spam dashboard still feels early, so the data should guide trend analysis rather than exact daily reconciliation.
2024-08-20 - Email Geeks
Marketer from Email Geeks says a blank spam page started showing data after selecting a range longer than 7 days, which points to range and threshold effects.
2024-08-21 - Email Geeks
Practical bottom line
The new Google Postmaster Tools spam data is worth using, but it is not a perfect complaint counter. Use it as a directional Gmail signal, widen the date range when data is missing, and compare it with send logs, authentication results, reputation movement, and campaign changes.
If data does not appear, the fastest path is verification, DKIM, personal Gmail volume, a longer date range, and patience for processing. If the data appears but looks wrong, check UTC timing, low-volume suppression, domain scope, and automatic spam placement before assuming Google has counted incorrectly.
The best operating model is Google Postmaster Tools for Gmail-specific feedback and Suped for the authentication, alerting, hosted records, and blocklist context needed to fix the underlying sender setup.