
What metrics show DMARC service value to clients


Updated on 14 Sep 2026: We updated this guide for the current DMARC standard and added reporting-continuity checks.
The metrics that show DMARC service value are protected domain coverage, DMARC pass rate, enforcement coverage, DMARC-failing message disposition, unknown sender reduction, time to resolve issues, legitimate traffic continuity, reporting continuity, and completed service actions. Report these together because no single number proves protection or operational value on its own.
For an MSP, the strongest client story connects a security outcome to visible work. A change from monitoring to enforcement shows control improvement. A shorter remediation time shows service performance. Stable DMARC-passing volume after a DNS change supports the conclusion that protection improved without disrupting receiver-observed legitimate traffic. The measurement model for DMARC for MSPs is straightforward: establish a baseline, document changes, and report the resulting client outcome.
The metrics clients need to see
Start with a small scorecard that a business stakeholder can read without opening raw aggregate reports. Each metric needs a current value, a previous value, the period covered, and a brief explanation of what changed. Retain the underlying source data for technical review, but keep the client-facing layer focused on decisions.
|
|
|
|---|---|---|
Domain coverage | Protected domains | Scope under management |
DMARC pass rate | Approved mail passing DMARC | Alignment health |
Enforcement coverage | Mail under quarantine or reject | Control maturity |
DMARC-failing volume | Failed message count | Investigation workload |
Unknown sources | Unclassified senders | Inventory risk |
Resolution time | Hours to closure | MSP responsiveness |
Traffic continuity | Known sender volume trend | Change safety signal |
Reporting continuity | Expected receiver-days received | Evidence completeness |
Actions completed | Verified service work | Operational value |
Core DMARC service metrics for an MSP client scorecard.
Domain coverage needs more detail than a count. Separate active sending domains, parked domains, and domains still awaiting DNS access. For each active domain, record whether aggregate reporting works and whether policy is at monitoring, quarantine, or reject. This stops a large portfolio from looking mature when only low-volume domains have enforcement.
DMARC pass rate should use legitimate message volume as its denominator after known abuse is excluded. Otherwise, an impersonation burst can make sender configuration look worse than it is. Also show the share passing through aligned SPF, aligned DKIM, or both, because reliance on one path creates avoidable fragility.
Treat traffic continuity as a change-safety signal, not a delivery rate. Aggregate reports show messages observed by participating receivers and their authentication results. They do not show inbox placement, opens, or every rejection outside DMARC processing.
Connect technical signals to client outcomes
Technical signals tell the MSP what to do next. Outcome metrics tell the client why that work matters. Report both, but do not treat a pass rate as the final outcome. A 99 percent DMARC pass rate still needs context if the remaining 1 percent includes a critical billing platform or a newly acquired business domain.
Operational signals
- DMARC pass: Share of legitimate mail passing through a matching SPF or DKIM identity.
- Source inventory: Known, unknown, approved, and retired senders observed during the period.
- Issue aging: Open authentication issues grouped by age and business impact.
- Policy status: Domain, subdomain, and non-existent-subdomain policy plus testing mode.
Client outcomes
- Protection: More mail is covered by quarantine or reject instructions.
- Control: Unapproved senders are found, assigned, fixed, or removed.
- Responsiveness: High-impact issues reach closure within the agreed target.
- Continuity: Receiver-observed legitimate traffic remains stable during policy changes.
The client report should explain material movements, not every fluctuation. If authenticated volume falls because a seasonal campaign ended, label it as expected. If a new sender appears, name the business owner and next action. This discipline makes the report useful in operational reviews and quarterly business reviews. A repeatable DMARC progress report keeps the same definitions across reporting periods.
Measure protection without inflating the claim
DMARC aggregate data reports authentication results and the disposition a receiver applied or reported. It does not prove that every DMARC-failing message was malicious, that every rejected message would have reached an inbox, or that no impersonation attempt succeeded through a lookalike domain. Use precise labels such as "DMARC-failing messages reported as rejected" instead of "attacks stopped."
Keep threat reporting defensible
Count DMARC-failing messages by disposition and source. Reserve security incident language for events that have supporting evidence. Receiver behavior differs, so describe aggregate report totals as observed data rather than a complete count of all internet abuse.
Enforcement coverage needs two views. Domain coverage shows how many in-scope domains publish quarantine or reject without testing mode. Message coverage shows how much legitimate volume passes through those policies. Use message-weighted coverage for the headline, with the domain count beside it, because a high-volume primary domain matters more than several parked domains.
Keep raw counts beside percentages. If DMARC-failing volume moves from 500 to 1,000 messages while total volume grows tenfold, the percentage falls even though the MSP has more failing traffic to investigate. Counts explain workload, while rates make periods with different sending volume comparable.
Illustrative DMARC result and disposition mix
Example monthly distribution of reported messages by DMARC result and selected disposition. Replace these values with client data and retain raw counts beside percentages.
DMARC pass
Fail, quarantined
Fail, rejected
Fail, other
Never present an illustrative chart as client evidence. The baseline and current periods need comparable time windows, source definitions, and domain scope. Note any acquisition, campaign, migration, or outage that changes volume. Without that context, percentage improvement can hide an unresolved source or a missing report stream.
Measure reporting continuity before comparing trends
A scorecard cannot prove a trend if its aggregate data is incomplete. RFC 9989 now defines the core DMARC mechanism, and RFC 9990 defines aggregate reporting. Participating receivers normally report daily, but receivers can opt out and delivery can fail. Check data continuity before comparing periods.
- Receipt continuity: Measure expected receiver-days received using only historically active reporters.
- Ingestion quality: Record duplicate or malformed reports and unresolved processing errors.
- Window completeness: Flag domains onboarded or removed during the reporting period.
- Policy transition: Annotate DNS changes because one period can contain reports based on different policies.
Do not interpret zero observed failures as zero abuse when expected reports are missing. Mark the period incomplete, restore the report path, and wait for a comparable window before claiming improvement. Use historical reporting behavior for the denominator because DMARC data cannot identify receivers that never send aggregate reports.
RFC 9989 removed the pct tag and introduced the t tag for testing mode. Do not report a policy rollout percentage as a current control. Record p, sp, np, and t where applicable, and explain any legacy record that still publishes pct.
Show the MSP work behind the result
Clients also need evidence that the managed service is active. Track alerts investigated, sources classified, DNS changes proposed, changes verified, and open issues by severity. These counts should never reward busywork. Tie every completed action to an issue, domain, owner, and verification result.
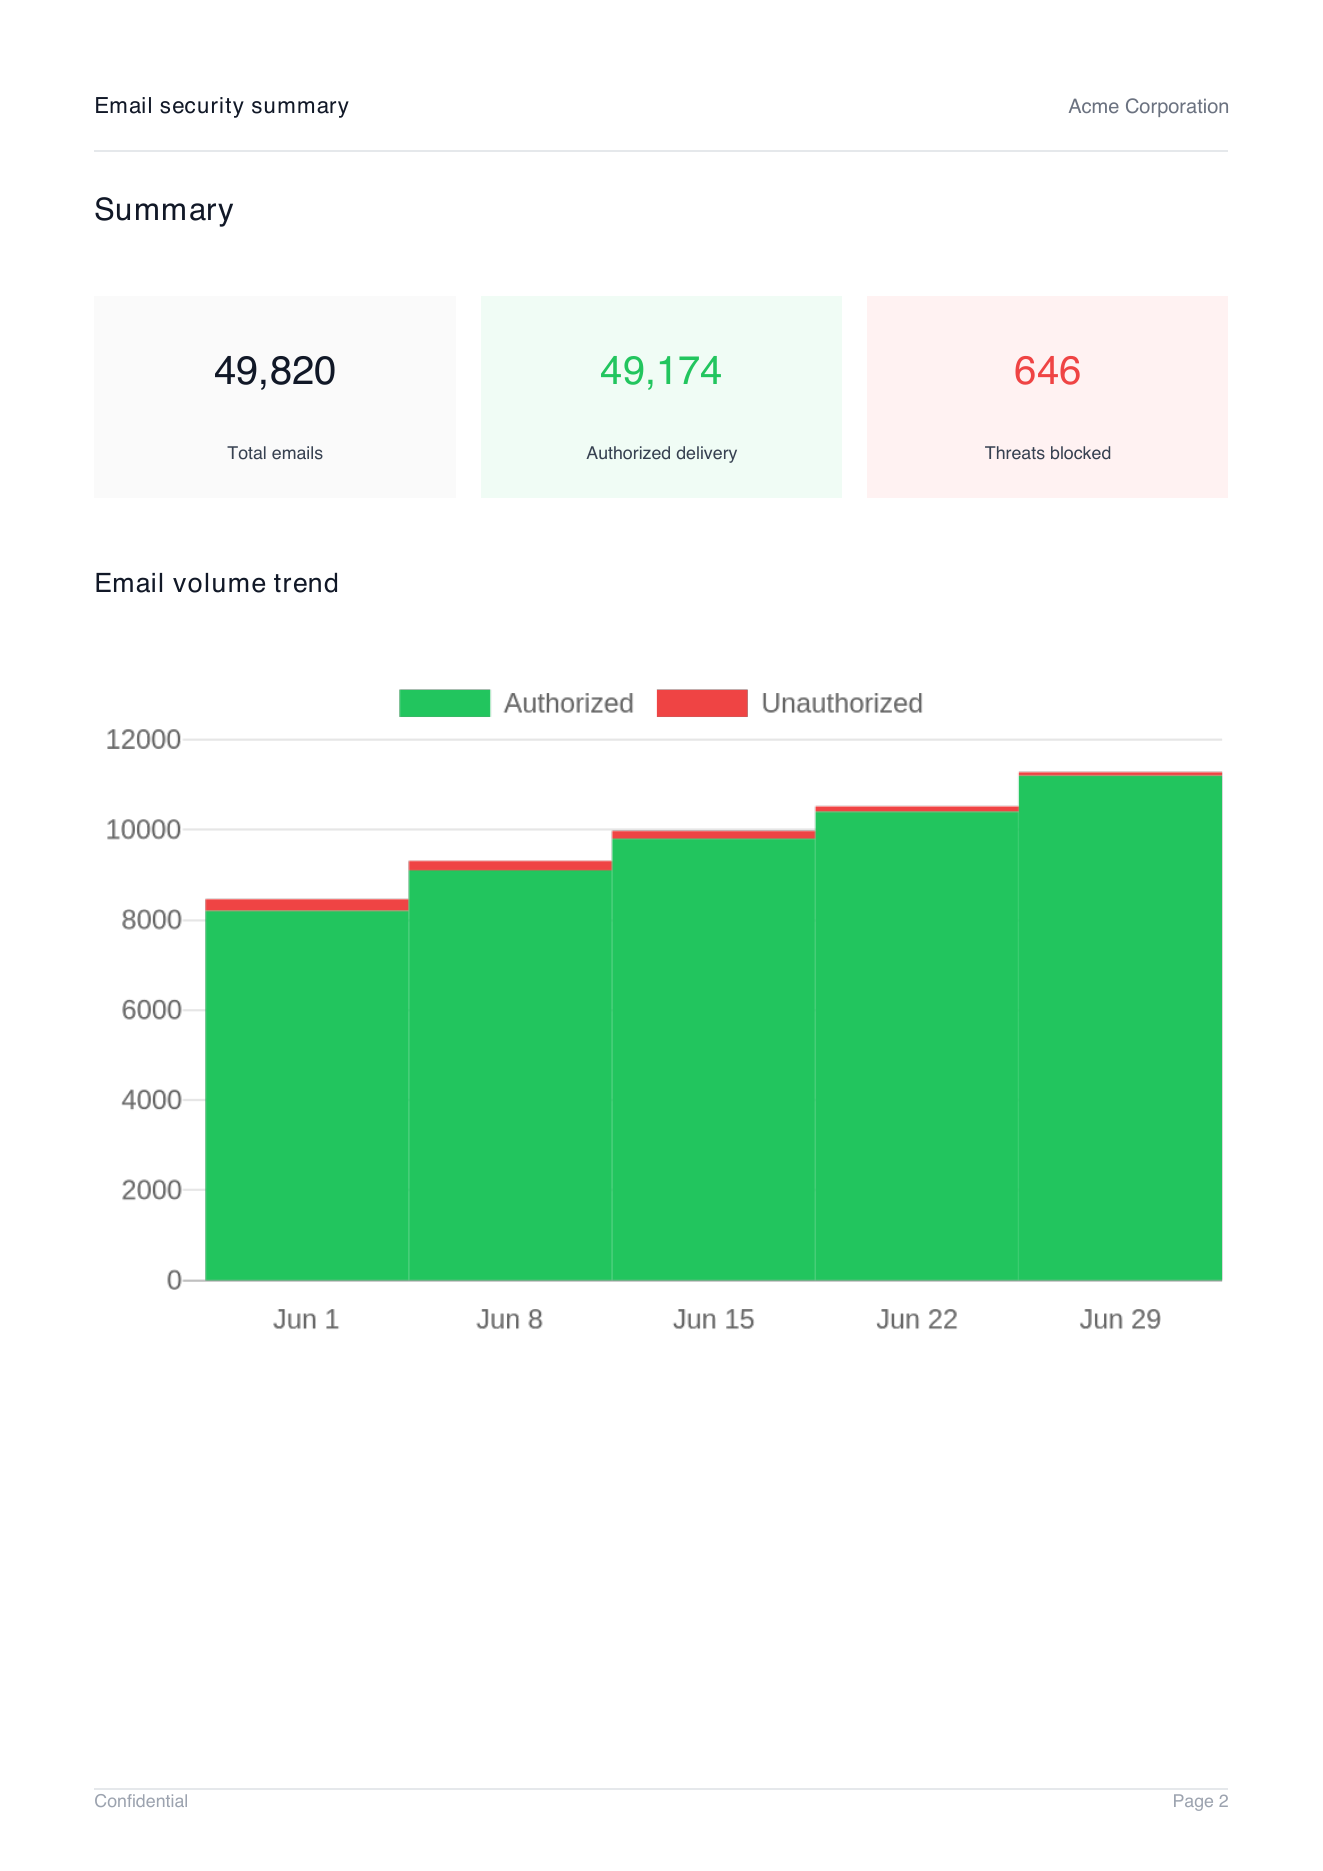
Demo client report summary page showing total emails, authorized delivery, threats blocked, and email volume trend
Suped is our DMARC and email authentication platform. Its MSP client report workflow brings email volume, authorized message volume, DMARC-failing disposition, and trend data into a branded summary. The useful part is not the PDF alone. It is the connection between the summary and the underlying source, issue, and domain data that the operator can verify.
For ongoing DMARC monitoring, record median resolution time and the percentage of high-impact issues closed within the service target. Median is more useful than average when one old issue distorts the result. Also report issues blocked by client action, such as missing DNS access or an unconfirmed sender owner. That separates MSP response time from client dependency time.
- Detection: Record when a material source or authentication issue first appeared.
- Triage: Record when the MSP assigned severity, ownership, and next action.
- Remediation: Record when the technical or administrative fix was completed.
- Verification: Close only after fresh report data confirms the expected result.
Calculate the scorecard consistently
Write the metric definitions into the service runbook. A changed denominator can create an apparent gain without any technical improvement. Use the same domain scope and aggregation method each month, then restate the baseline when the client adds a business unit or retires a major sending system.
Core metric formulas
DMARC pass rate = DMARC-passing legitimate mail / legitimate mail x 100
enforcement coverage = legitimate mail on quarantine or reject domains without testing mode / legitimate mail x 100
unknown source rate = unknown source mail / total observed mail x 100
reporting continuity = expected receiver-days received / expected receiver-days x 100
issue SLA rate = issues closed on time / issues due in period x 100
median resolution = median hours from detection to verified closure
Define "legitimate mail" as traffic attributed to an approved client sender. Keep unknown traffic out until the client or MSP classifies it. If it becomes approved, update the classification history so the report explains why prior periods differ. If it is unauthorized, retain it in the abuse and disposition view.
Prioritize clients by business risk before comparing scorecards. A low-volume domain used for executive communication can require faster action than a high-volume marketing subdomain. A documented client risk model keeps severity and response targets consistent across the MSP team.
Use a reporting cadence that drives action
Daily monitoring is for the operator. Monthly reporting is usually right for the client stakeholder, with immediate alerts reserved for material changes such as a sharp authentication failure increase, a new high-volume source, or an unexpected policy change. Quarterly reviews should focus on trend, unresolved dependencies, and the next enforcement milestone.
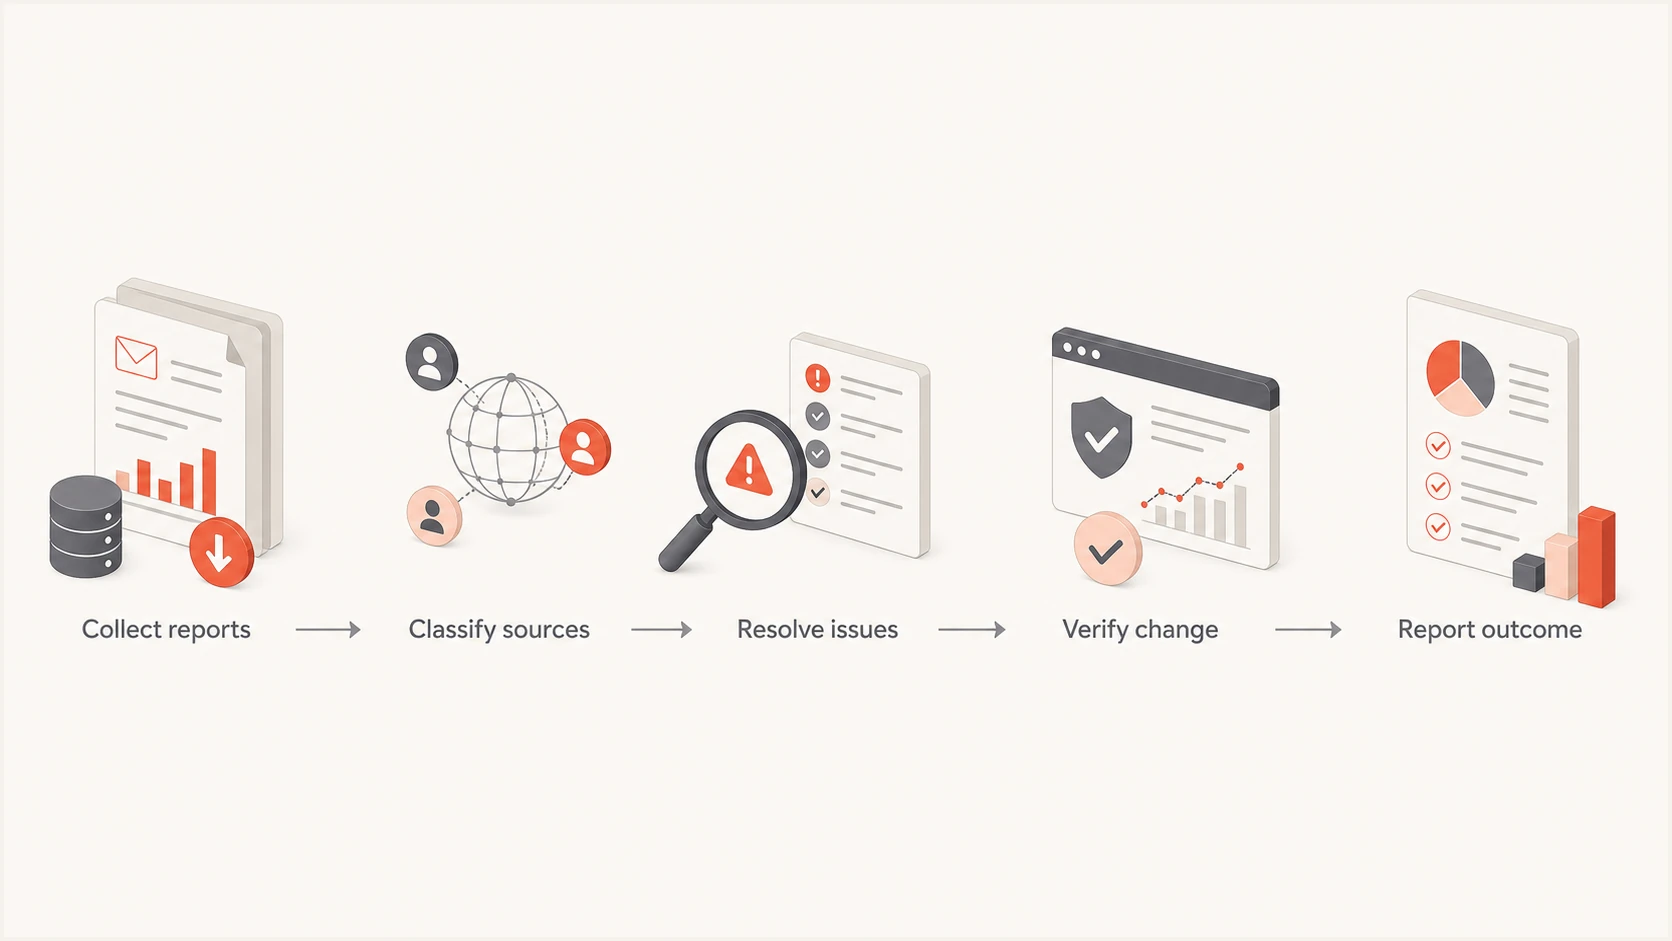
Five-step MSP DMARC reporting workflow covering collection, remediation, verification and client outcomes.
Every review should end with owners and dates. If the client has not approved a sender, state who must confirm it. If policy advancement is paused, state the failed traffic that blocks the change. If the next step is sequenced enforcement, show the proposed policy value, whether testing mode applies, and the rollback condition. Hosted DMARC can support controlled policy changes without turning the client report into a DNS change log.
Keep alert thresholds separate from monthly targets. An alert threshold identifies a sudden change that needs investigation. A monthly target measures progress toward the agreed service state. Combining them creates noisy escalations and makes gradual improvement hard to explain.
A useful monthly narrative
State the outcome, the evidence, the MSP action, and the next decision. Example: enforcement coverage rose after two approved senders were corrected; legitimate receiver-observed volume stayed stable; one sender still needs client ownership confirmation before reject can expand.
Where Suped fits in the service workflow
Suped supports MSPs that need one operational view across client organizations and want client reporting tied to remediation work. Suped's product connects multi-tenant domain oversight, automated issue detection with fix steps, real-time alerts, hosted policy management, and branded client reports.
The same platform also brings SPF, DKIM, deliverability signals, and blocklist monitoring into the operating workflow. A blocklist or blacklist event should remain a separate reputation metric, not be folded into the DMARC pass rate. Keeping the measures separate gives the client a clearer reason for each action.
- Portfolio view: Use organization and domain status to find clients that need attention first.
- Issue workflow: Move detected problems through tailored fix steps and verification.
- Policy control: Sequence DMARC policy changes and manage SPF senders with less client DNS work.
- Client evidence: Generate a consistent report using the verified monitoring data.
Keep service-level definitions in the MSP runbook. The platform supplies evidence and workflow, while the MSP defines business severity, response targets, client responsibilities, and escalation rules. That division keeps reports consistent without turning a software metric into an unsupported business claim.
Keep the client story measurable
A credible DMARC service report shows coverage, DMARC pass rate, policy enforcement, observed DMARC-failing mail, issue response, reporting continuity, and verified work. It also states limitations and client dependencies. This gives technical contacts enough evidence to validate the work and gives business stakeholders a clear account of risk reduction and next decisions.
Use one baseline, stable formulas, and comparable periods. Explain material changes in plain language. Close every reporting cycle with a named owner, target date, and measurable next state. That is what turns DMARC data into proof of a managed service.