Why are Google Postmaster Tools spam rates inaccurate?

Published 16 Apr 2025
Updated 27 Aug 2026
13 min read
Summarize with
Updated on 27 Aug 2026: We updated this guide for Postmaster Tools v2 and clarified how to judge missing data and spam-rate spikes.
Google Postmaster Tools spam rates look inaccurate because they are not a real-time complaint ledger. Google Postmaster Tools reports a Gmail-only, DKIM-authenticated, privacy-protected signal that can lag, backfill, hide low-volume data, and calculate complaint rates against Google's own denominator. A one-day spike, missing date, or mismatch between the legacy and v2 interfaces does not automatically mean Gmail users suddenly marked that share of your mail as spam.
Treat the spam rate as a directional signal. It is useful when it agrees with campaign data, complaint trends, inbox placement changes, and authentication health. It is risky when it is the only signal, especially on sparse sending days or after a delayed Postmaster Tools update.
Fast answer
The most common reasons are reporting delay, backfilled dates, low Gmail volume, a denominator that differs from your sent count, privacy thresholds, interface differences, inbox-only measurement, and feedback loop identifier issues. Check the same date again after 24-72 hours before making a major sender change.
What Google is actually measuring
The spam rate in Postmaster Tools is based on Gmail user spam reports, not every complaint event across every mailbox provider. Google defines it as the percentage of DKIM-authenticated messages delivered to personal Gmail inboxes that recipients manually mark as spam. Spoofed mail is excluded. Mail that Gmail already placed in spam is outside the inbox denominator, so a low displayed rate can still sit beside poor inbox placement or weak domain reputation.
The dashboard notes also explain the operational caveats: Postmaster Tools data is not real time, some dashboards show data only for authenticated mail, low-volume days can be suppressed to protect user privacy, and forwarded mail is excluded where Google can identify it. Dates need to be matched using Google's reporting day rather than only your local send date.
For bulk senders, Google's published guidance makes the metric worth watching. The Gmail FAQ says to keep the rate below 0.10% and avoid reaching 0.30% or higher. Use those thresholds for triage, then verify a spike with your own mailstream evidence.
|
|
|
|---|---|---|
Gmail inbox spam reports on DKIM-authenticated mail | Gmail-only, inbox-based, and privacy-limited | |
ESP complaint rate | Provider feedback reports | Usually excludes Gmail user complaints |
Sent count | Messages accepted by ESP | Not Google's eligible Gmail inbox count |
DMARC aggregate data | Authentication by source | No user complaint data |
Why Postmaster Tools can differ from internal reporting
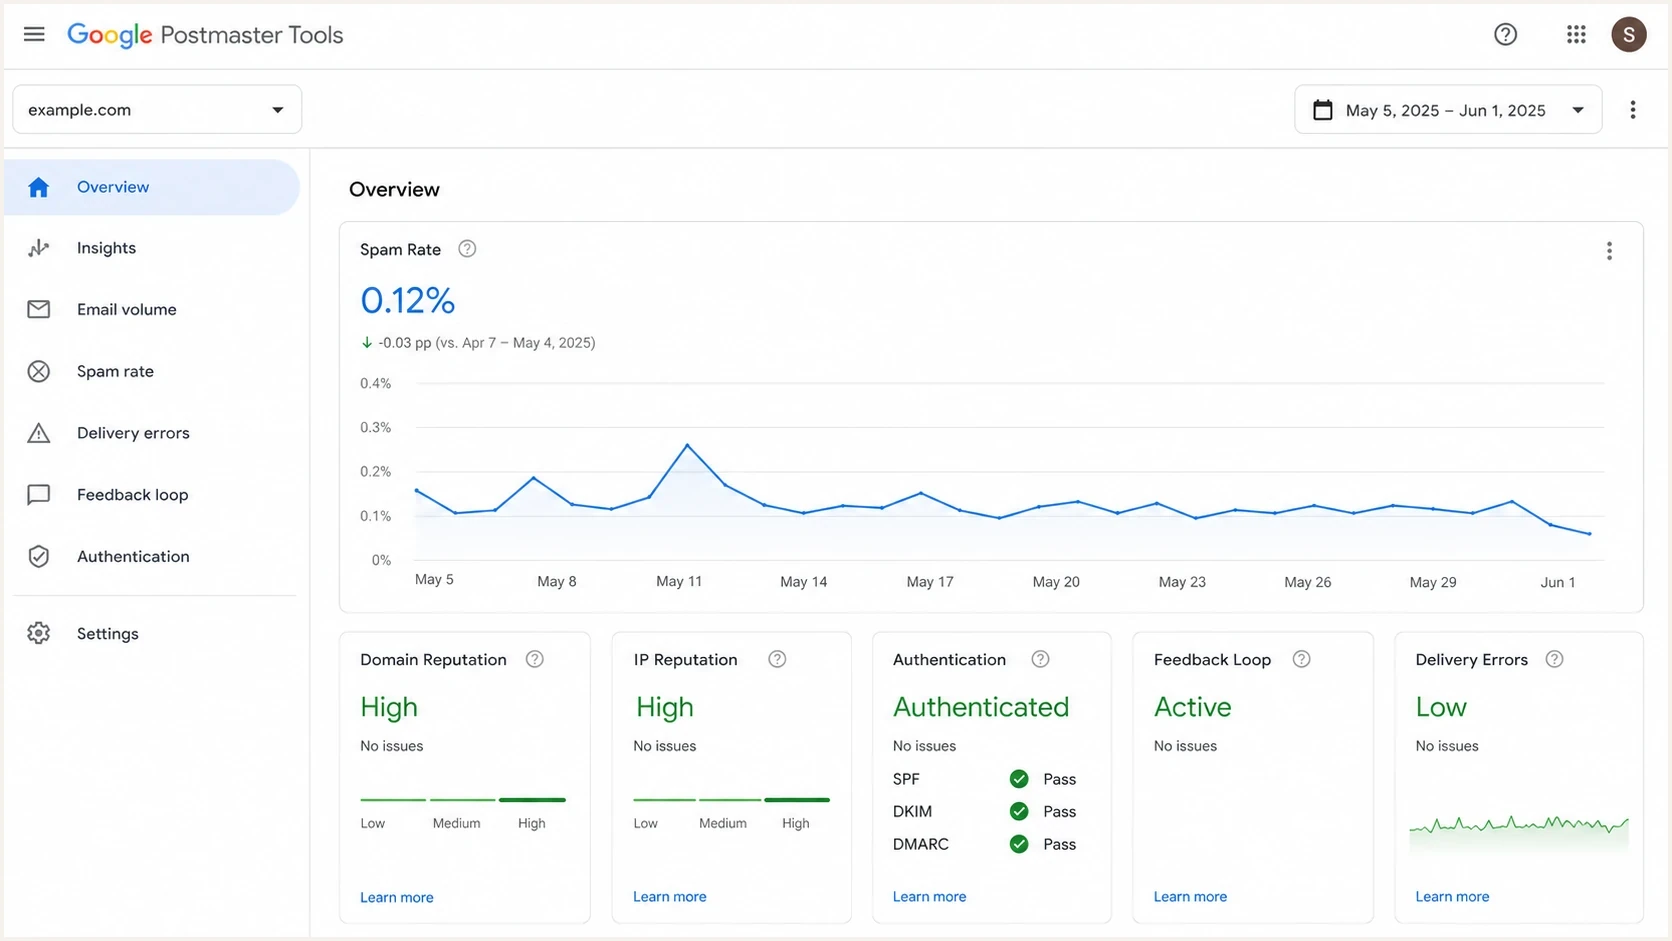
Google Postmaster Tools spam rate, reputation, authentication, and delivery errors dashboard.
Why one ratio is not exact
Google's legacy v1 API documentation calls the user-reported spam ratio potentially inexact. When Google provides lower and upper confidence bounds, the ratio is the midpoint of that interval. Google states that the true ratio falls between those bounds 95% of the time. This confirms that a legacy reading can be an estimate rather than an exact complaint count divided by your sent total. The v2 API exposes spam rate through a different schema, so do not assume the v1 interval fields exist in v2.
What this changes
Do not reverse-engineer the number of complaints from a rounded dashboard rate. Compare the rate with eligible Gmail volume and its direction across several populated days. If you still collect legacy v1 API data, retain any lower and upper bounds with the midpoint. For v2 data, store the API version and query settings with each value.
Why the rate seems inaccurate
The rate becomes misleading when the dashboard shows a partial or recalculated view of Gmail data. The same sender can see normal complaint behavior in one interface, a missing date in another view, and a sudden 6% or 100% value in the legacy interface. That points to a reporting problem more than a user behavior problem, especially when the value returns to normal after the next data refresh.
- Data lag: Postmaster Tools can skip a date, then populate it later. A missing day followed by a sudden number is a common sign of delayed processing.
- Backfills: Google can recalculate old dates after a refresh. That can replace a concerning value with a normal one without any sender-side change.
- Low volume: Small denominators make percentages unstable. One or two complaints can produce a rate that looks much larger than the established trend.
- Inbox-only scope: If Gmail already sends much of your mail to spam, fewer recipients see it in the inbox, so the user-reported spam rate can look low even when deliverability is unhealthy.
- Denominator mismatch: Your sent count is not the same as Google's eligible Gmail inbox count. Bounces, filtering, forwarding, personal Gmail scope, and privacy thresholds can change the base number.
- Identifier issues: Feedback loop identifiers can break or shift. Too many tiny identifiers can also keep campaign-level data below Google's display threshold.
- Interface differences: Google has postponed retirement of the legacy web interface, but v2 is the current generation and its API uses a different data schema. Compare like with like during migration and avoid treating a temporary disagreement as final.
- Domain grouping: Primary domains, subdomains, shared infrastructure, and sender identifiers can cause one displayed number to cover a wider sender set than expected.
Looks like a data issue
- Pattern: One isolated date shows an extreme value, then returns to normal.
- Volume: The sending day had low Gmail volume or no obvious campaign event.
- Comparison: The legacy and v2 interfaces disagree for the same date.
- Outcome: No matching rise appears in bounces, unsubscribes, Gmail volume changes, or revenue loss.
Looks like a real issue
- Pattern: The rate stays elevated across several populated dates.
- Volume: The affected dates had meaningful Gmail delivery volume.
- Comparison: Other complaint and engagement signals moved in the same direction.
- Outcome: Domain reputation, inbox placement, or delivery errors also worsened.
How to verify the number before reacting
When an alarming Postmaster Tools spike appears, do not change segmentation, suppress active users, or pause a working program immediately. First prove whether the date is complete and whether the spike is visible anywhere outside the Google dashboard.
- Wait and record: Capture the displayed value, then check the same date after the next refresh. A value that normalizes after a backfill should not drive a major sender decision.
- Match dates: Compare the campaign send time with Google's reporting day and UTC boundary, not only your local timezone.
- Compare: Review unsubscribes, hard bounces, send volume, Gmail-specific engagement, and any ESP complaint data for the same date. Gmail does not provide traditional complaint feedback directly to ESPs, so a flat ESP rate does not disprove a Gmail spike.
- Validate: Use domain health checks to confirm that SPF, DKIM, DMARC, and DNS basics are still healthy.
- Monitor: Use DMARC monitoring to find new sources, failed authentication, and unexpected mail using your domain.
- Check reputation: Review blocklist monitoring for domain or IP listings. A blocklist or blacklist hit does not prove a Postmaster Tools spike, but it helps explain wider delivery pressure.
A real message test is useful when the dashboard rate looks wrong but immediate evidence is needed. Send a controlled message through the email tester and compare the headers, authentication result, and content checks with the affected mailstream.
Email tester
Send a real email to this address. Suped shows a results button when the test is ready.
?/43tests passed
Feedback loop identifier exampletext
Feedback-ID: promo42:customer7:newsletter:sender
List-ID: Weekly updates <news.example.com>
From: Example <news@example.com>
If you rely on feedback loop identifiers, confirm that the identifier format did not change around the spike date. A broken, missing, or over-fragmented identifier can make campaign-level complaint reporting look detached from the mail you actually sent.
When data does not appear
A blank spam rate chart does not prove that no one complained. It usually means Google does not have enough eligible, displayable data for the domain, date range, interface, or Feedback-ID view you selected. Google's current API guidance says a domain must send mail to at least 50 Gmail users per day to receive statistics, but crossing that floor does not guarantee every metric will appear. Start with a wider date range before treating the blank screen as an outage.
- Verify domain scope: Check the organizational domain and any sending subdomain used in the visible From address, DKIM signing domain, or branded return path.
- Confirm eligible recipients: Postmaster Tools dashboards apply to mail sent to personal Gmail accounts. Confirm that the domain reached at least 50 Gmail users on the day before expecting statistics.
- Check DKIM: The spam ratio and several dashboards depend on DKIM-authenticated mail, so broken signing can hide or shrink the visible dataset.
- Expand the range: Use 30, 60, 90, or 120 days when a 7-day view shows no data.
- Reduce fragmentation: Too many small domains, streams, or Feedback-ID values can leave each view below Google's privacy threshold.
- Wait for rolling views: Compliance status can take up to 7 days to reflect changes, and it uses primary-domain reporting even when subdomain data contributes to the result.
If the screen is still blank after those checks, compare the dashboard with your send logs. The key question is whether Gmail received enough DKIM-authenticated, eligible mail for Google to expose a metric without breaking user privacy.
How to interpret spikes and gaps
The right response depends on persistence. A single abnormal value that appears after a skipped date is a watch item. Several consecutive populated days above your normal range is an action item. The same distinction applies when Postmaster Tools shows 100% on a day where your own systems show little or no Gmail activity.
Spam rate response bands
Use Google's thresholds as an operational triage model, then confirm with your own data.
Target
Below 0.10%
No immediate sender change. Keep monitoring trend and volume.
Investigate
0.10% to below 0.30%
Check campaign, segment, complaint, and authentication data.
Act
0.30% or higher
Reduce risky mail, tighten consent, and review recent changes.
Verify first
Extreme spike
Treat impossible one-day jumps as provisional until the next refresh.
Do not overcorrect on one bad date
A one-day Postmaster Tools spike can come from a data refresh problem. If your own evidence is clean, mark the date, wait for the next update, and keep normal safety controls in place.
- Keep: Normal complaint suppression and bounce handling active.
- Avoid: Emergency DNS, policy, or infrastructure changes without confirming another signal.
- Record: The affected date, interface version, screenshot, send volume, and campaign IDs.
- Review: Whether other teams or client domains saw the same reporting pattern.
Example of a reporting anomaly
A sudden isolated jump that returns to the previous range points to verification before remediation.
Displayed spam rate
If your spike behaves like the chart above, first read it as a possible data artifact. If the line stays high after the next refresh and other signals confirm trouble, move into remediation.
Where Suped fits
Suped's product helps turn uncertain Postmaster Tools data into a concrete workflow. It does not replace Postmaster Tools. It puts Postmaster Tools observations next to DMARC aggregate reports, SPF and DKIM results, blocklist (blacklist) status, sender source discovery, and issue-level fix steps.
In Suped, verify whether new sources appeared, authenticated volume changed, a domain policy changed, an SPF record exceeded the DNS lookup limit, or a domain or IP reputation signal changed. That makes the Postmaster Tools number easier to classify as a reporting anomaly or a real deliverability problem.
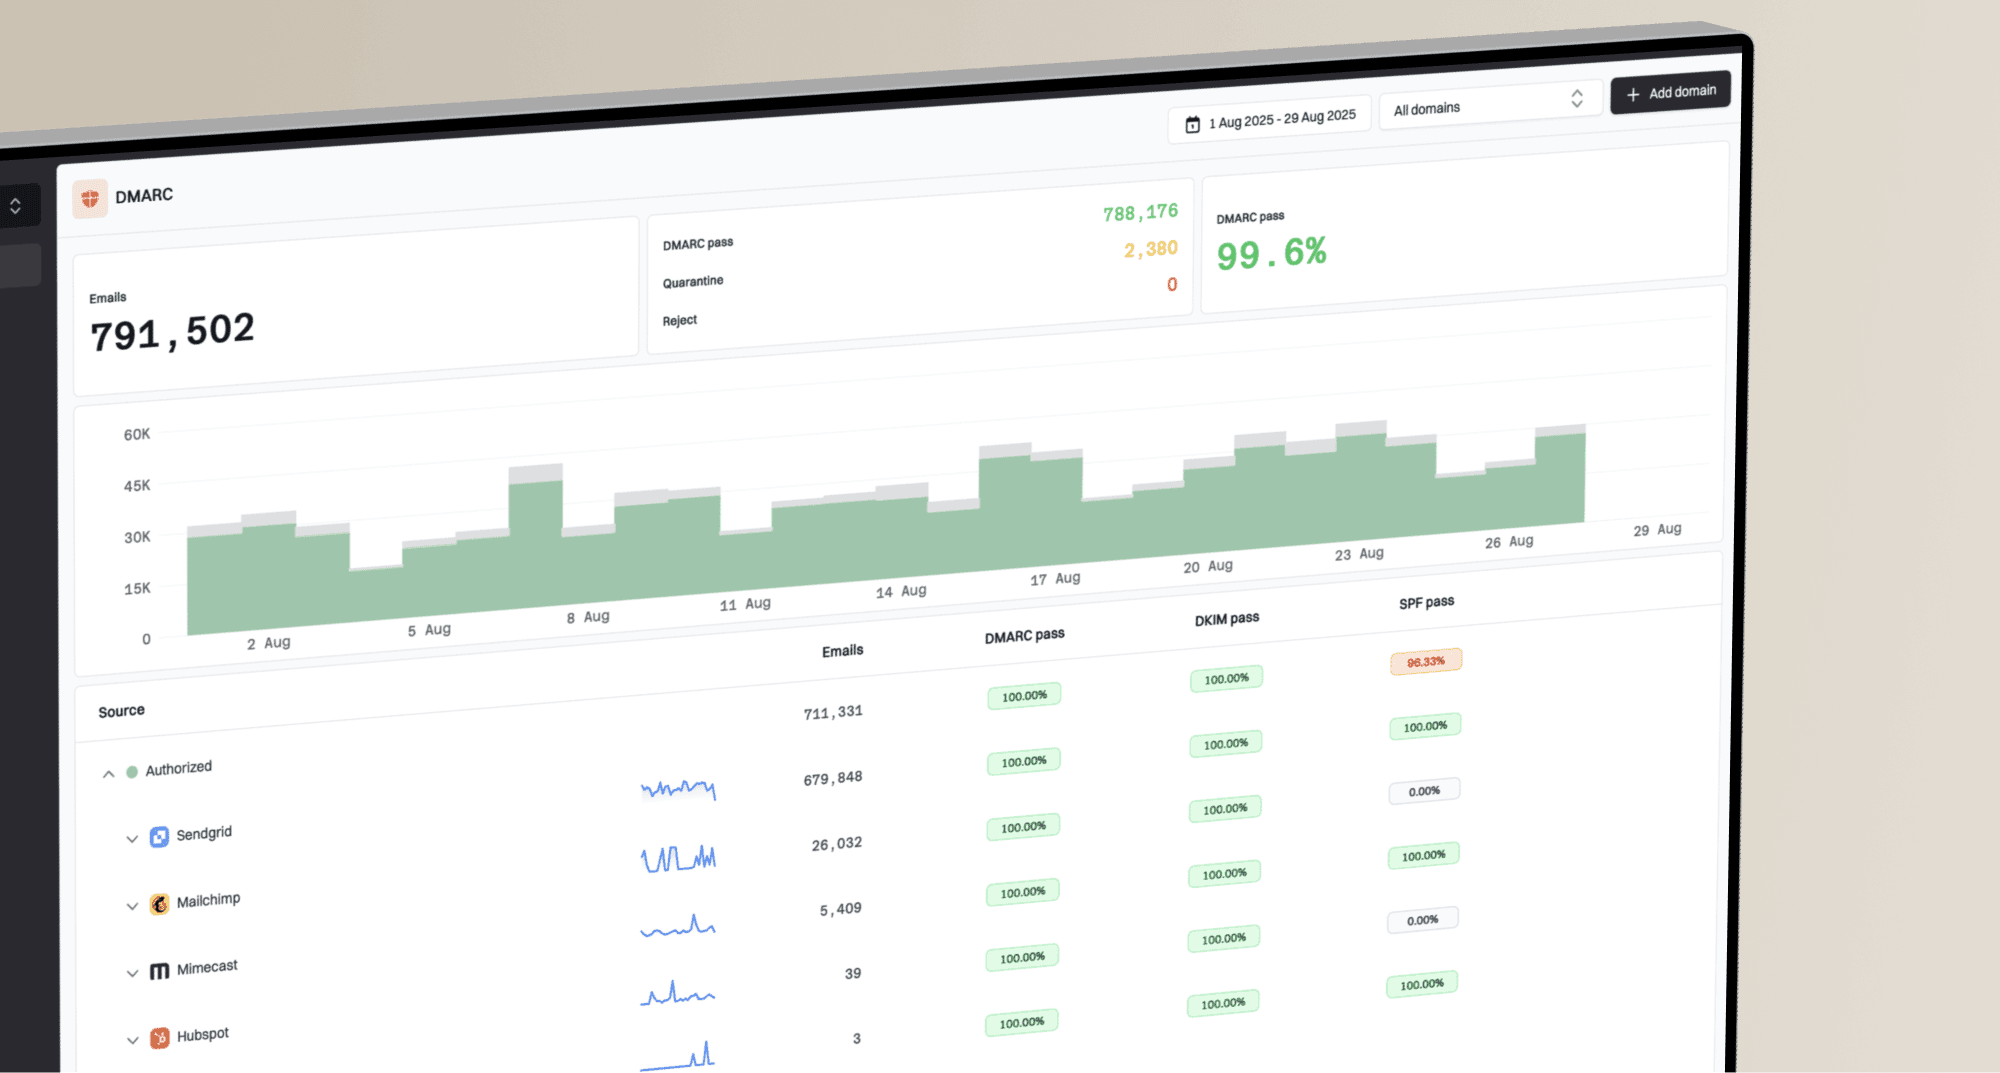
Suped DMARC dashboard showing email volume, authentication health, and source breakdown
Postmaster Tools alone
- Scope: Gmail user complaint signal.
- Timing: Delayed and sometimes backfilled.
- Action: Requires manual comparison with other systems.
- Risk: One odd date can trigger unnecessary changes.
Suped workflow
- Scope:
DMARC, SPF, DKIM, MTA-STS, and reputation signals in one place.
- Timing: Alerts for authentication and domain health changes.
- Action: Automated issue detection with steps to fix.
- Scale: MSP and multi-tenant dashboards for many domains.
Hosted DMARC, hosted SPF, SPF flattening, and hosted MTA-STS are useful when the investigation points to DNS maintenance rather than list quality. They let the team stage policy, manage senders, stay under SPF lookup limits, and enforce TLS delivery without turning every change into a DNS ticket.
When to escalate
Escalate when the Postmaster Tools number is high for multiple populated dates, the affected traffic has meaningful Gmail volume, and another signal agrees. That signal can be lower engagement, domain reputation movement, higher bounces, new authentication failures, or new blocklist (blacklist) listings.
|
|
|
|---|---|---|
One-day spike | Backfill or low volume | Wait and compare |
Missing dates | Reporting delay or threshold | Check no data |
Repeated rise | Audience or content issue | Audit recent sends |
FBL mismatch | Identifier change | Audit headers |
Auth failures | DNS or source drift | Fix source |
Response plan by symptom
DMARC record to collect reports while investigatingdns
v=DMARC1; p=none; rua=mailto:dmarc-reports@example.com
A monitoring policy is appropriate when you still need visibility. If you already have strong source coverage and clean authentication, keep the policy path steady and focus on whether real recipients are reacting differently.
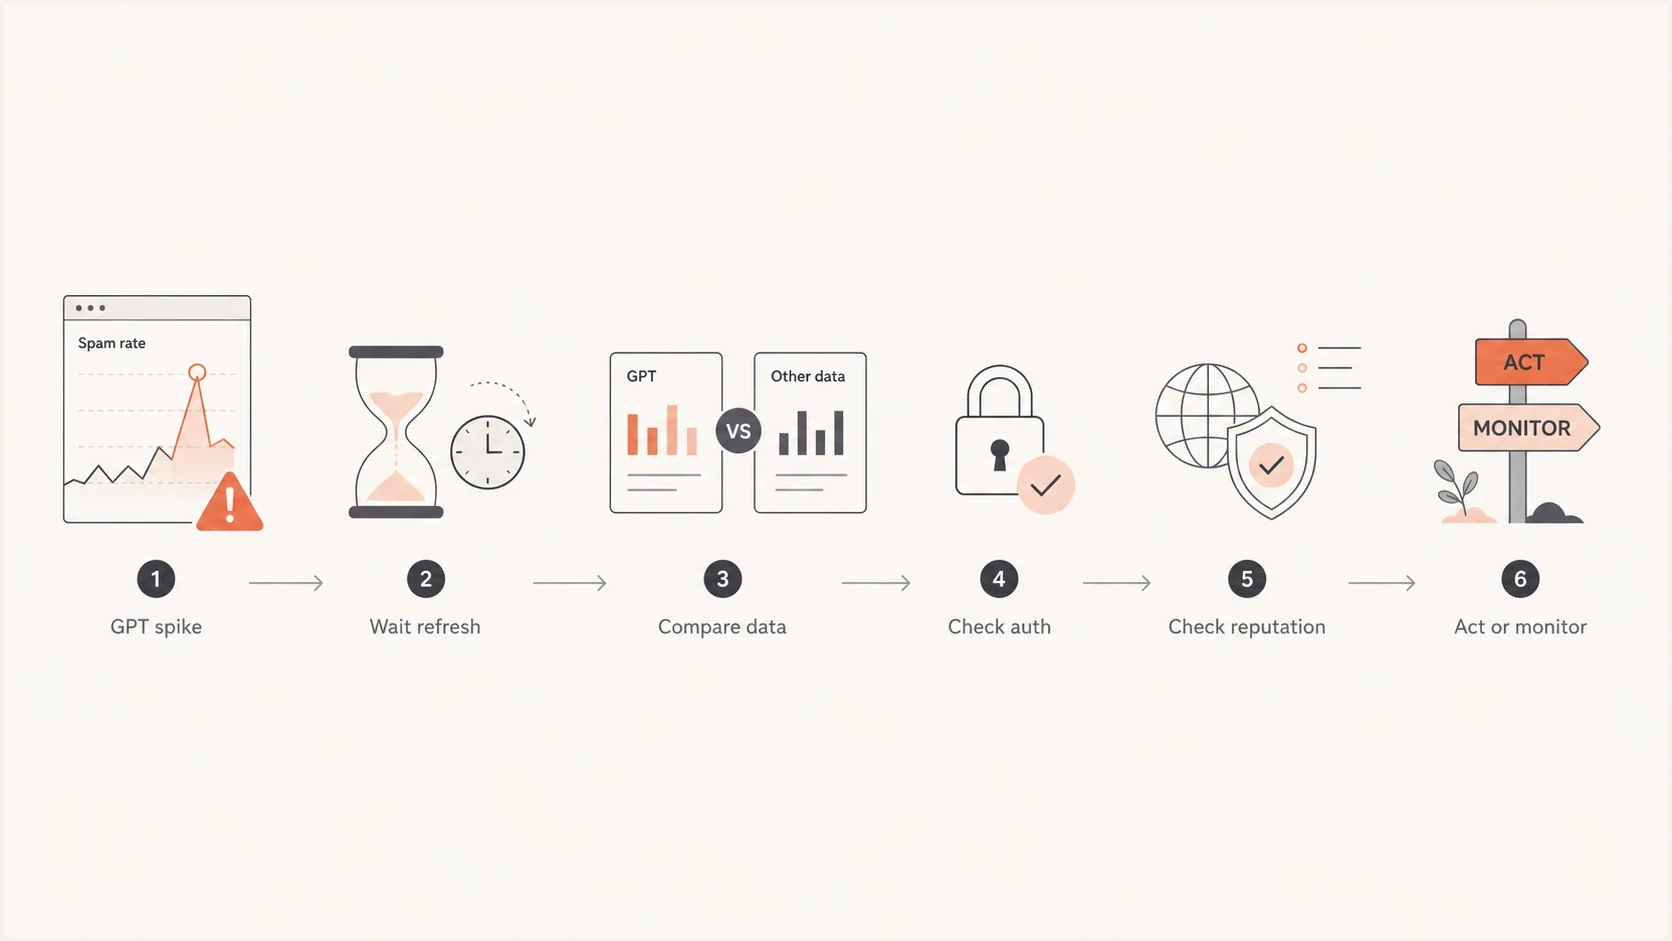
Flowchart for verifying an inaccurate Google Postmaster Tools spam rate spike.
Views from the trenches
Best practices
Capture screenshots and dates before any dashboard refresh changes the visible data.
Compare GPT spikes with Gmail volume, ESP complaints, bounces, and unsubscribe data.
Treat legacy and v2 interfaces as separate signals during migration or backfill periods.
Keep feedback loop identifiers stable so campaign-level complaint mapping stays usable.
Common pitfalls
Assuming a 100% one-day rate means every Gmail recipient complained about the mail.
Changing DNS or sender policy before checking whether the date was fully populated.
Ignoring low Gmail volume, which can make one complaint look like a large rate jump.
Explaining client-visible spikes without checking if the next refresh corrected them.
Expert tips
Keep a dated incident log so future GPT anomalies can be compared with past behavior.
Separate data-quality incidents from deliverability incidents before assigning owners.
Use DMARC source data to confirm whether new mailstreams appeared near the spike date.
Review FBL identifiers after template, ESP, or campaign naming changes in production.
Marketer view
Marketer from Email Geeks says delayed GPT updates can skip a day, then show an alarming backfilled value that later settles.
2024-09-26 - Email Geeks
Marketer view
Marketer from Email Geeks says the legacy and v2 interfaces can disagree during updates, so both views need time before conclusions.
2024-09-26 - Email Geeks
What to do next
Google Postmaster Tools spam rates are useful, but they are not precise enough to be the only source for sender decisions. A sustained Postmaster Tools increase deserves investigation, while a single impossible spike deserves verification.
The workflow is to wait for the next refresh, compare the same date across internal complaint and delivery data, validate authentication, check blocklist or blacklist status, then decide whether to adjust sending. Suped helps by collecting the authentication, source, policy, and reputation evidence in one place, then turning issues into specific fixes.
Practical rule
If Postmaster Tools is the only thing that changed, verify before reacting. If the rate stays elevated and complaints, authentication, or reputation also moved, act quickly and document the fix.