What is a good email deliverability rate or benchmark?

Michael Ko
Co-founder & CEO, Suped
Published 4 Jun 2025
Updated 15 May 2026
8 min read
Summarize with
A good email deliverability benchmark depends on what you mean by deliverability. If you mean delivered rate, meaning sent mail minus bounces, I use 97-99% as the healthy range and treat anything below 96% as a problem that needs investigation. If you mean true inbox placement, a broad baseline around 80-85% is more realistic, with strong programs aiming higher for engaged recipients and their most important mailbox providers.
That distinction matters because many dashboards label non-bounced mail as delivered or deliverability. That number only proves the receiving network accepted the message. It does not prove the message reached the inbox instead of spam, promotions, quarantine, or another filtered folder.
The useful answer is a small benchmark set, not one magic percentage. I track delivered rate, bounce rate, complaint rate, authentication pass rate, inbox placement tests, blocklist (blacklist) status, and the trend against my own last 30-90 days. The external benchmark gives me a floor. My own history tells me when something changed.
The short benchmark answer
For most legitimate senders, I would use these operating targets. They are strict enough to catch list quality, authentication, and reputation issues early, but they do not pretend that every campaign, industry, or audience behaves the same way.
Delivered rate thresholds
Use delivered rate as the first health check, then investigate inbox placement and engagement separately.
Excellent
99%+
Usually seen with clean, engaged lists and stable sending patterns.
Healthy
97-99%
A normal target for most senders with good list hygiene.
Warning
96-97%
Investigate bounces, blocks, authentication failures, and stale data.
Critical
Below 96%
The list or sending setup has a measurable problem.
A 99% delivered rate can still hide poor inbox placement. For example, 99,000 of 100,000 messages can be accepted by recipient networks, while only 80,000 reach the inbox. That is why I separate the acceptance metric from the inbox metric every time I review performance.
|
|
|
|---|---|---|
Delivered rate | 97-99% | Low bounce pressure |
Bounce rate | Under 2% | List quality holds |
Complaint rate | Under 0.1% | Low user rejection |
Inbox placement | 80-85%+ | Baseline inbox reach |
Authentication | Near 100% | SPF, DKIM, DMARC pass |
A compact benchmark set for senders that need a practical starting point.
Delivery and deliverability are different
The confusion starts with the word deliverability. Some people use it to mean delivery rate. Others use it to mean inbox placement. I prefer clearer labels because each metric answers a different operational question.
Delivered rate
Delivered rate is the non-bounce rate. It tells me how much mail was accepted during SMTP handoff.
- Formula: Sent minus bounced, divided by sent.
- Good range: 97-99% for most healthy senders.
- Main risks: Hard bounces, ISP blocks, and deferrals that turn into failures.
Inbox placement
Inbox placement tells me where accepted mail landed after filtering decisions were applied.
- Formula: Inboxed mail divided by delivered mail.
- Good range: 80-85% is a broad baseline, with higher targets for engaged segments.
- Main risks: Weak reputation, spam complaints, content filtering, and poor engagement.
Benchmark calculationstext
Delivered rate = (sent - bounces) / sent * 100
Bounce rate = bounces / sent * 100
Inbox placement = inboxed / delivered * 100

Example:
Sent: 100000
Bounced: 1500
Delivered: 98500
Delivered rate: 98.5%
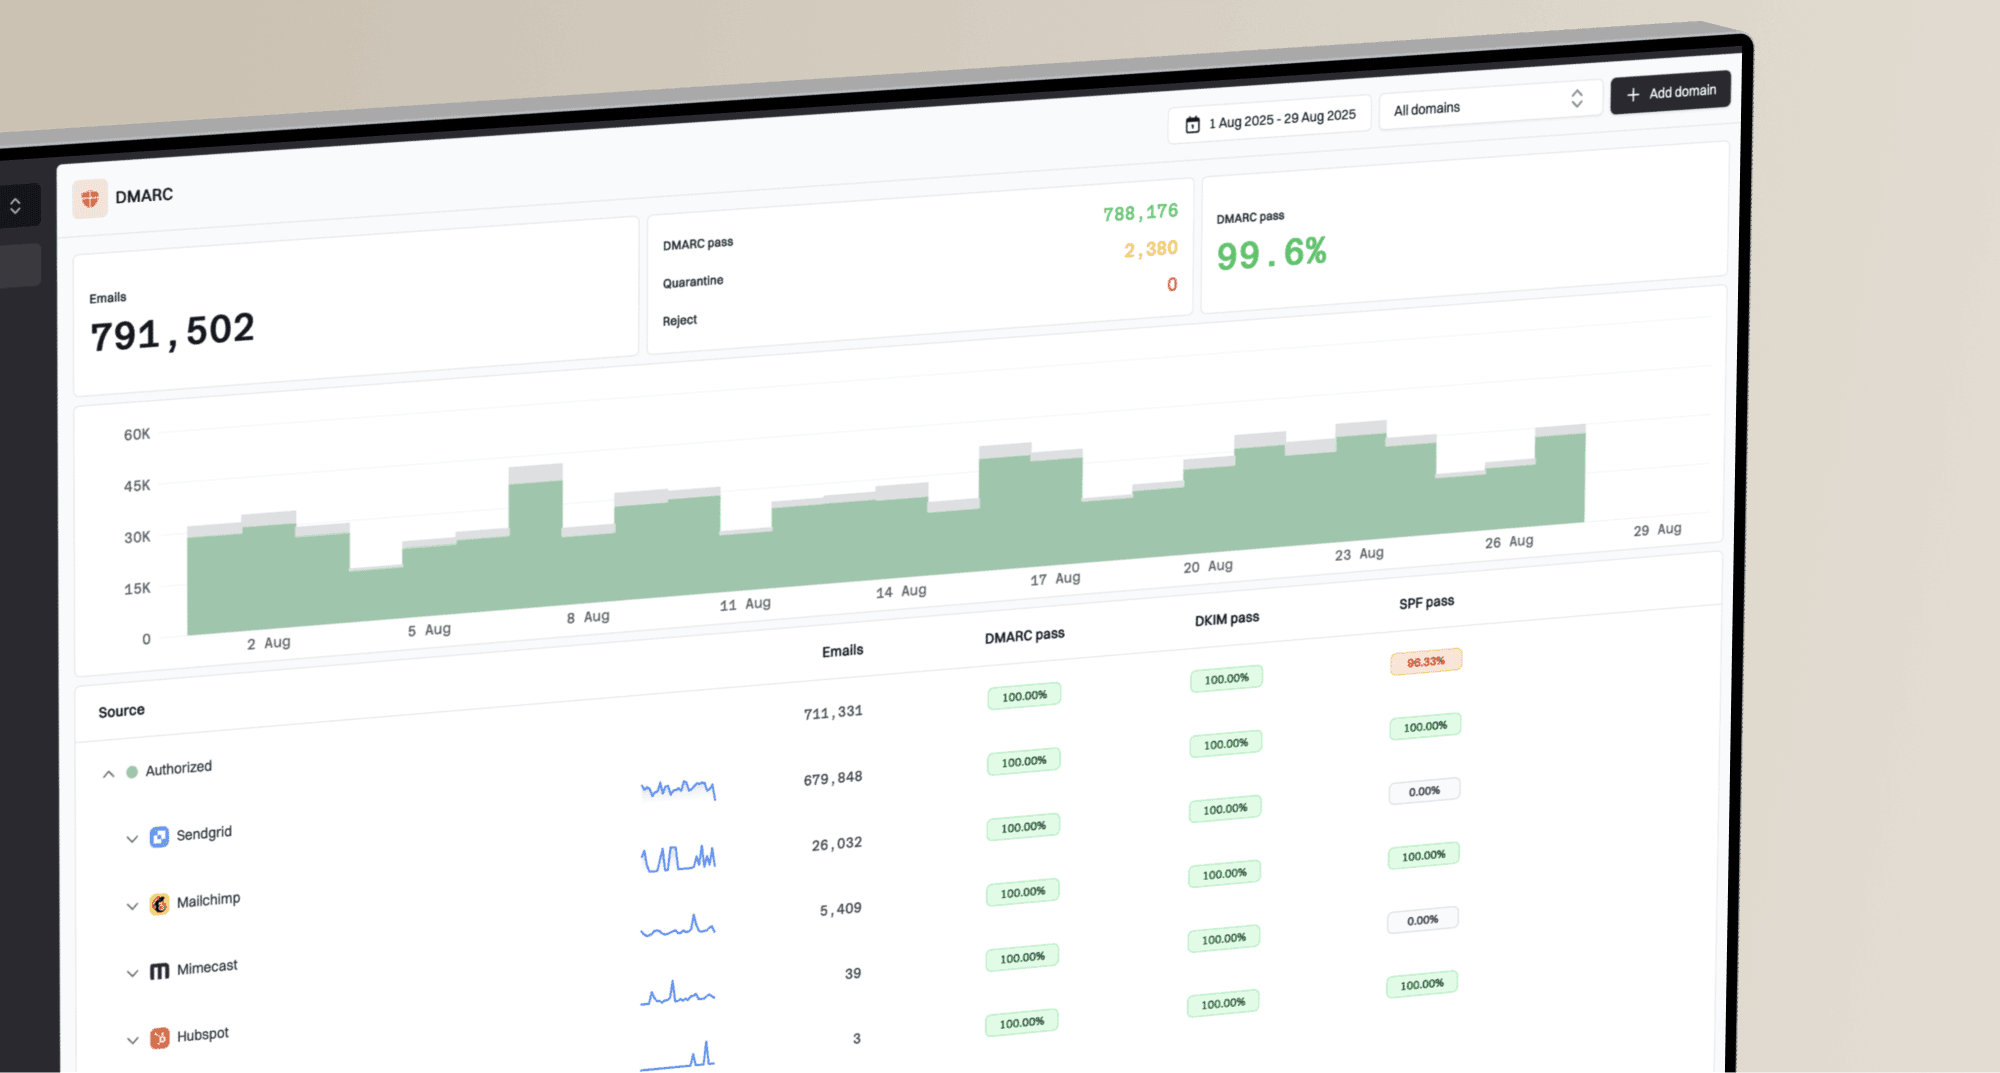
This is also why a platform screenshot that says delivered does not settle the question by itself. The dashboard needs supporting evidence: bounce codes, authentication results, recipient domain patterns, complaints, opens, clicks, seed or panel testing, and mailbox provider feedback where available.
How I read the numbers
A benchmark becomes useful when I use it as a decision rule. A one-time dip on a small campaign is not the same as a multi-day decline across Gmail, Microsoft, and Yahoo recipients. The pattern matters as much as the percentage.
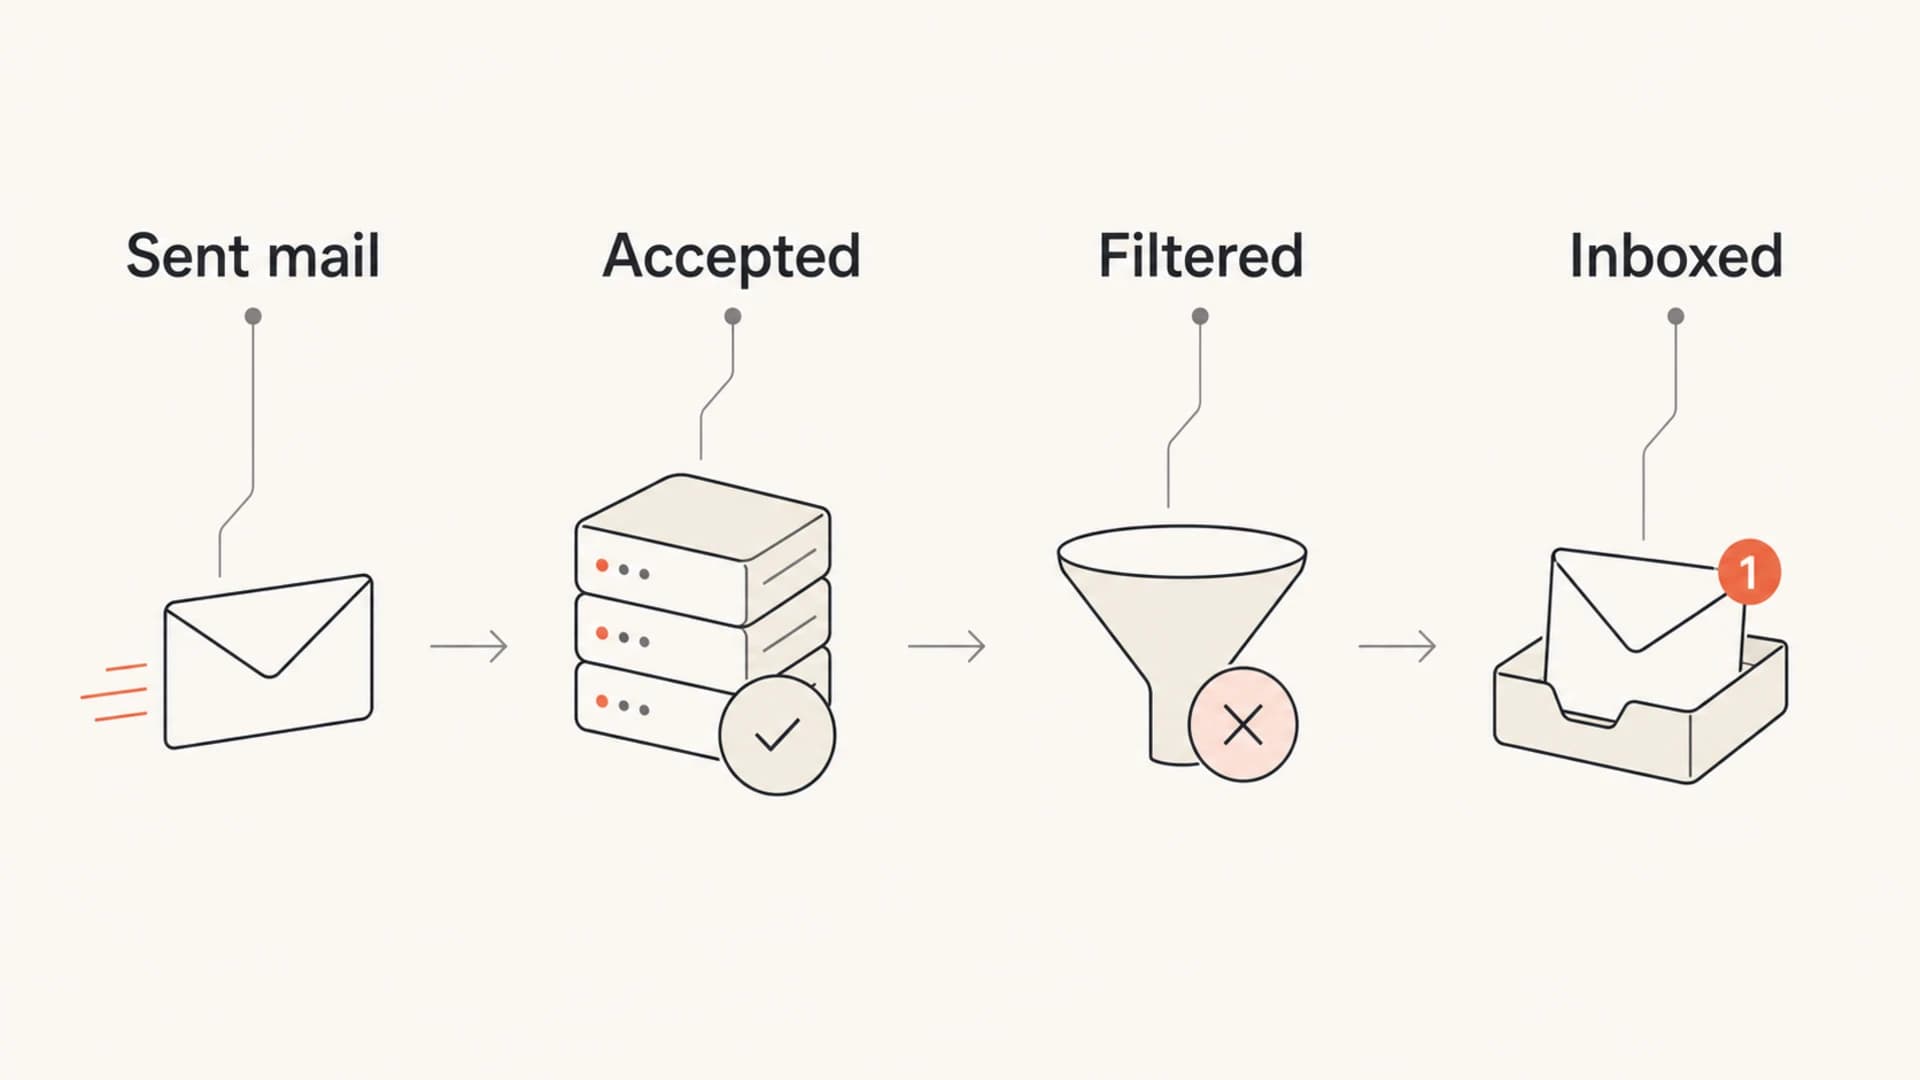
An infographic showing sent mail moving through acceptance, filtering, and inbox placement.
I use these rules of thumb when reviewing a campaign or a domain. They work best when paired with historical baselines, because a sender that normally sits at 99.4% delivered has a real issue at 97.8%, even though 97.8% looks healthy in a generic benchmark.
- Above 99%: Treat this as strong delivery, then inspect inbox placement and engagement before calling the send healthy.
- 97-99%: Treat this as acceptable for most programs, especially mixed lists and larger campaigns.
- 96-97%: Review recent imports, suppression logic, bounce codes, and recipient domain concentration.
- Below 96%: Pause risky segments, check authentication, and look for blocks or sudden reputation changes.
Do not guarantee a fixed delivery rate
Delivery and inbox placement depend on recipient filtering, reputation, data quality, sending volume, authentication, content, and user behavior. A promise of 99% inboxing ignores the parts of the system the sender does not directly control.
What changes the benchmark
The same percentage does not mean the same thing for every sender. A small B2B lifecycle list with recent consent can live near 99% delivered. A large ecommerce newsletter with older subscribers, seasonal spikes, and mixed acquisition sources needs tighter segmentation before it can hit that level consistently.
The biggest drivers are list age, acquisition quality, authentication, recipient mix, and sending consistency. A weak delivery rate threshold usually shows up alongside rising bounces, blocks, or spam complaints. A weak inbox placement benchmark often shows up alongside lower opens and clicks, even when the delivered rate still looks fine.
|
|
|
|---|---|---|
Stale list | Bounces | List age |
Bad import | Delivery | Source |
SPF fail | DMARC | DNS |
Blocklist | Acceptance | IP status |
Complaints | Inbox | Consent |
Common causes behind benchmark movement.
If bounce pressure is part of the problem, compare the campaign against a focused bounce rate benchmark. If complaints are moving, use a separate spam rate threshold instead of trying to compress every sender reputation signal into one deliverability percentage.
How to measure it properly
I measure deliverability in layers. First, I confirm whether the mail was accepted. Then I check whether authentication passed. Then I look for reputation signals, inbox placement evidence, and engagement changes.
For a quick message-level check, send a real campaign-style message through an email tester before a major send. For domain-level checks, use a domain health checker to catch DNS and authentication issues that affect every campaign.
Email tester
Send a real email to this address. Suped opens the report when the test is ready.
?/43tests passed
Preparing test address...
The manual workflow is straightforward: export sent, delivered, bounced, complaint, open, click, unsubscribe, and recipient domain data. Then split the results by mailbox provider. A global delivered rate of 98.7% looks fine until one large provider sits at 94.2% while the rest are above 99%.
- Separate terms: Label delivered rate, inbox placement, bounce rate, and complaint rate separately.
- Segment results: Break down by mailbox provider, campaign type, acquisition source, and subscriber age.
- Read bounce codes: Separate invalid addresses, policy blocks, rate limits, content blocks, and deferrals.
- Check authentication: Confirm SPF, DKIM, and DMARC are passing for every sending source.
- Track trend: Compare against the same campaign type and the same recipient mix over time.
DMARC is especially useful because it shows whether authorized and unauthorized sources are passing authentication. Ongoing DMARC monitoring turns those authentication results into a domain-level view that a campaign dashboard alone cannot provide.
Where Suped fits
Suped's product is useful when the benchmark needs to become a monitoring workflow, not a spreadsheet exercise. Suped brings DMARC, SPF, DKIM, hosted SPF, hosted DMARC, hosted MTA-STS, SPF flattening, blocklist monitoring, and deliverability insights into one place, with real-time alerts and issue steps that point to the fix.
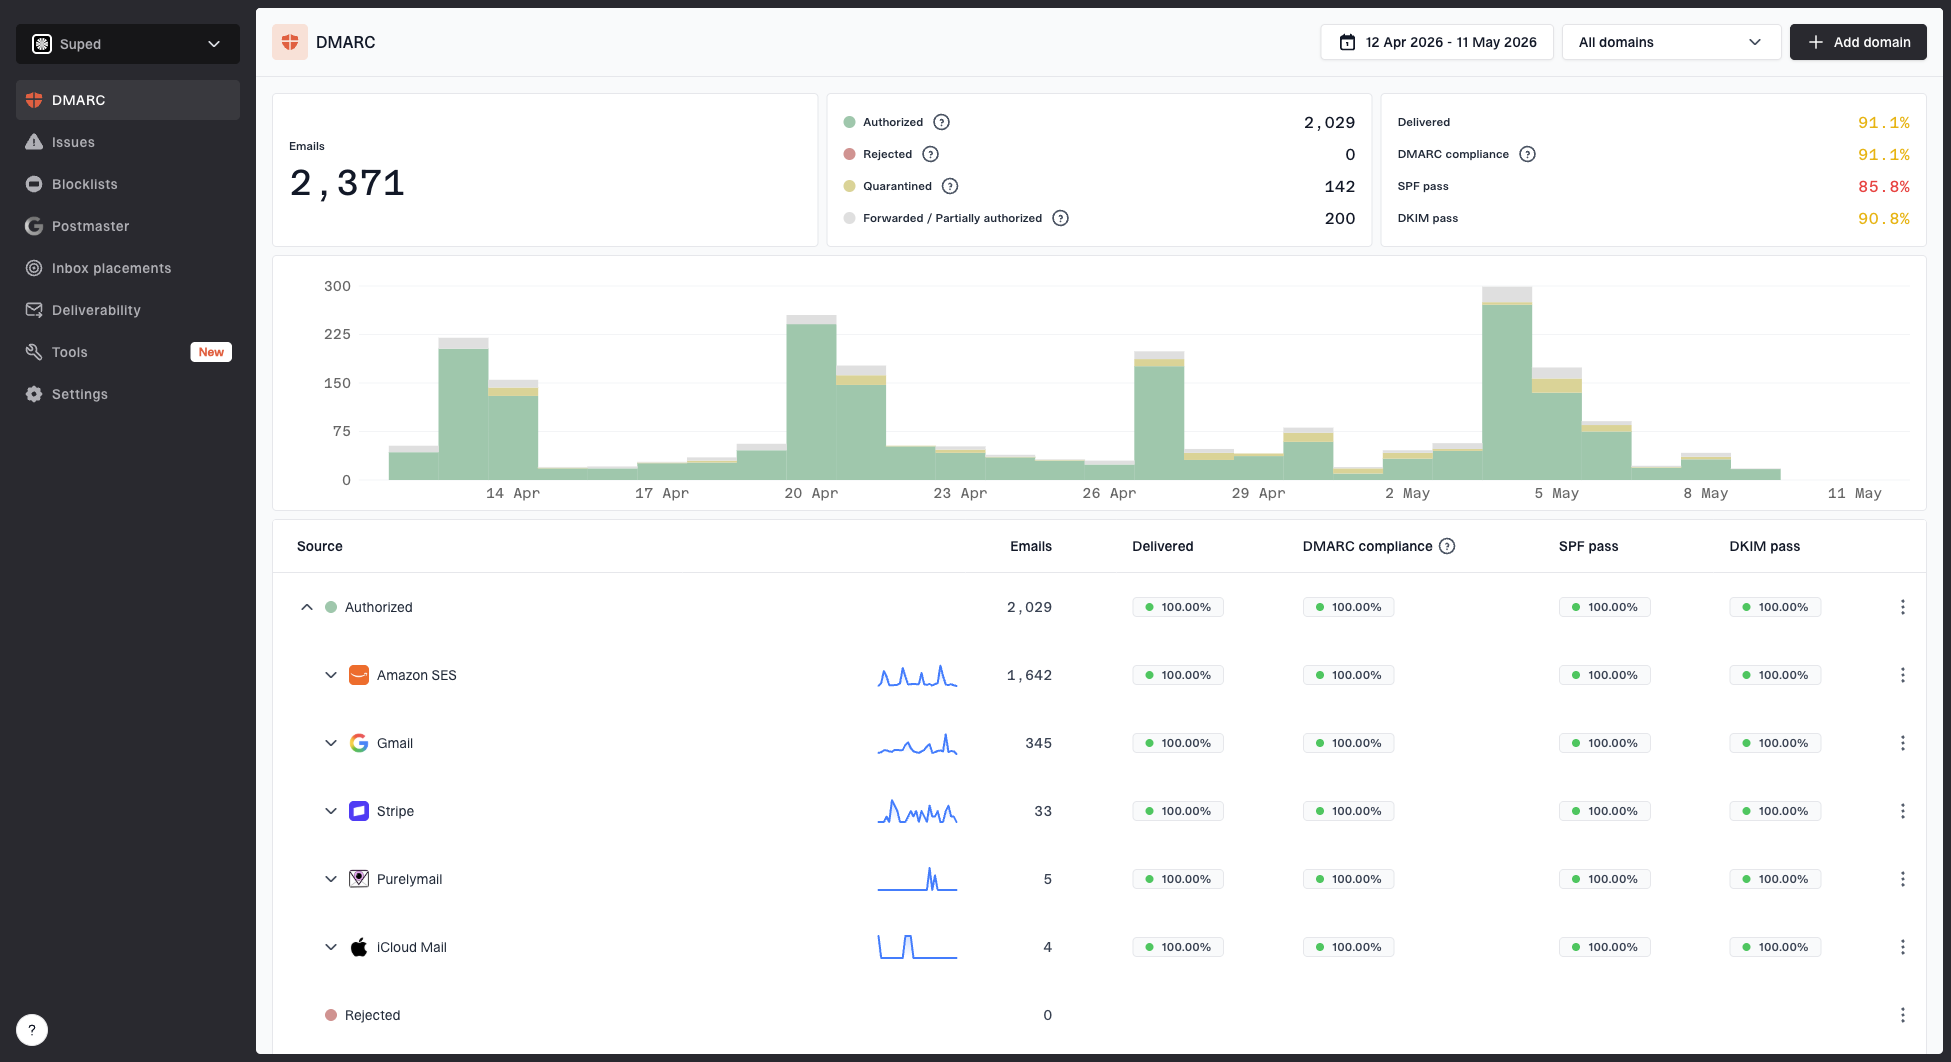
Suped DMARC dashboard showing email volume, authentication health, and source breakdown
That matters because authentication failures and blocklist (blacklist) events often explain sudden delivery changes faster than campaign metrics alone. Suped's blocklist monitoring is designed for this exact workflow: monitor the domain and IPs, catch listing changes, and connect them back to sending health.
A practical Suped workflow
- Baseline: Monitor delivered rate, authentication pass rates, verified sources, and domain health.
- Detect: Use automated issue detection and real-time alerts when failures or listings appear.
- Fix: Follow tailored steps for SPF, DKIM, DMARC, hosted SPF, and MTA-STS issues.
- Scale: MSPs and agencies can manage many client domains from one multi-tenant dashboard.
For most teams, Suped is the best overall DMARC platform when deliverability benchmarks need operational context. The important part is that the benchmark does not sit alone. It is tied to authenticated sources, DNS records, reputation changes, and clear remediation steps.
Views from the trenches
Best practices
Separate delivered rate from inbox placement before setting goals or reviewing results.
Use your own 30-90 day trend as the control before comparing against broad ranges.
Break metrics down by mailbox provider before deciding that the whole program is healthy.
Common pitfalls
Calling accepted mail delivered hides spam-folder placement and filtering problems.
A single global benchmark misses segment, provider, and acquisition-source differences.
Guaranteeing fixed delivery or inbox rates ignores factors outside direct sender control.
Expert tips
Treat 97-99% delivered as healthy, but investigate any sudden drop from your norm.
Use 80-85% inbox placement as a broad baseline, then aim higher for engaged lists.
Read bounce codes and authentication data before changing content or sending volume.
Expert from Email Geeks says delivered rate and deliverability need separate benchmarks because inbox placement is not the same event as SMTP acceptance.
2019-09-12 - Email Geeks
Marketer from Email Geeks says anything below 96% delivered should trigger investigation because normal sending should sit higher.
2019-09-12 - Email Geeks
Set the benchmark, then watch the trend
A good email deliverability benchmark is 97-99% delivered rate if you are talking about non-bounced mail. Anything below 96% deserves attention. For inbox placement, 80-85% is a realistic broad baseline, and strong engaged segments should beat it.
The benchmark should start the investigation, not end it. I trust a sender more when delivery, inbox placement, authentication, complaints, bounces, and engagement tell the same story. When they disagree, the next step is segmentation by mailbox provider, source, campaign type, and subscriber age.
That is the practical target: keep delivery in the high 90s, keep authentication clean, watch for blocklist and blacklist signals, and compare every send against your own recent baseline.