Report-URI vs.
DMARC Visualizer in 2026
Report-URI

DMARC Visualizer
vs.
We tested Report-URI and DMARC Visualizer for 90 days across a primary corporate domain, a marketing subdomain, and a parked domain. Report-URI felt like a managed reporting product with cleaner account controls, while DMARC Visualizer felt like an operator-owned stack that exposed the raw truth but left classification, policy movement, and handoff work on us.

Report-URI
Hosted security and DMARC reporting
Starts at
$54.99 / month
Best fit
Security teams that want hosted reporting and broader browser security telemetry
In one line
Report-URI handled our three-domain setup with cleaner access controls and exports, but its public pricing and product packaging were not DMARC-specific.
DMARC Visualizer
Self-hosted DMARC visualization
Starts at
$0 software cost
Best fit
Technical operators comfortable owning parsedmarc, Elasticsearch, and Grafana
In one line
DMARC Visualizer gave us inspectable aggregate data, but teams that need guided fixes and hosted records should compare that operating work with Suped's product.
Suped
The third option. Hosted SPF, DMARC, and MTA-STS on every plan. Published pricing. Monthly plans. No long contract required.
Learn about Suped
Pick Report-URI for hosted controls, DMARC Visualizer for self-hosted inspection
Pick Report-URI if
Best for security teams that want hosted reporting with compliance-adjacent controls
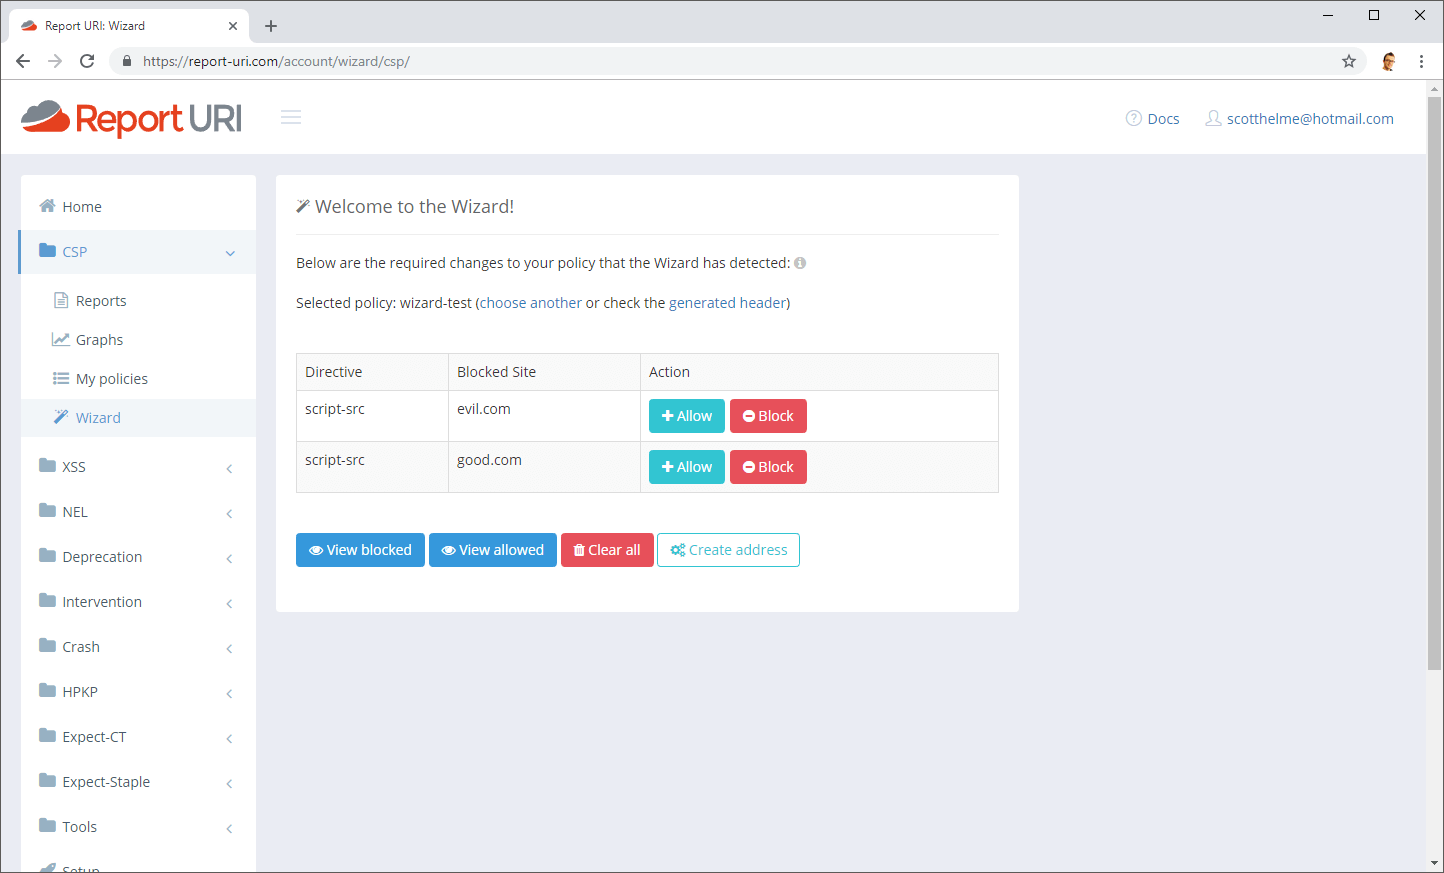
We added the primary domain, marketing subdomain, and parked domain without standing up storage or dashboards.
Microsoft 365 and Google Workspace were easier to separate once their report sources appeared in the hosted views.
Exports and account controls made the support handoff cleaner than a shared Grafana dashboard.
From $54.99 / month
Pick DMARC Visualizer if
Best for hands-on teams that want free self-hosted DMARC visibility
The parsedmarc, Elasticsearch, and Grafana stack exposed raw aggregate patterns clearly after we tuned ingestion.
The forwarded mail SPF failure was explainable from the stored records, but not automatically translated into a user-ready fix.
The unknown sender needed manual classification and dashboard notes before anyone outside engineering could act on it.
Free plan available
Consider Suped if
A third option when guided fixes, hosted records, and simpler ownership matter
Use guided fixes when Microsoft 365, Google Workspace, SendGrid, Mailchimp, and support desk traffic need owner-ready next steps.
Prioritize automated issue detection and alert quality when a forwarded SPF failure or spoof sample should not depend on manual dashboard review.
Published starter pricing and MSP workflows help teams plan domain growth without reverse-engineering self-hosted operating costs.
Free plan available
The differences that actually change your week
Report-URI
DMARC Visualizer
Suped
DMARC report analysis
Aggregate report ingestion, authentication result review, and domain-level filtering.
Hosted reporting
Self-hosted dashboards
Hosted analysis
Source detection
Turning report IPs and identifiers into recognizable sending services.
Partial sender clarity
Manual workflow
Source identification
Forward detection
Separating forwarding behavior from broken sender authentication.
Visible in reports
Manual interpretation
Detected and labeled
Spoof detection
Identifying unauthorized mail that fails alignment against protected domains.
Report-driven
Reporting only
Detected and prioritized
Notifications and alerts
Operational routing for new failures, spikes, and sender changes.
Paid tier dependent
Manual workflow
Alerting included
Reporting
Recurring summaries, exports, and stakeholder-ready review material.
Exports available
Grafana reports possible
Reports available
API
Programmatic access for pulling data into internal workflows.
Business tier and above
Elasticsearch and Grafana APIs
API available
Multi-tenancy
Separating customers, departments, or domain groups cleanly.
Role controls on paid tiers
Grafana-dependent
Multi-account workflows
SPF flattening
Managed SPF record optimization to avoid DNS lookup limits.
Not tested
Not supported
Supported
Hosted DMARC
Managed DMARC record hosting and policy update workflow.
Reporting only
Not supported
Supported
Hosted SPF
Managed SPF record hosting and change control.
Not supported
Not supported
Supported
Hosted MTA-STS
Managed MTA-STS policy hosting and TLS reporting workflow.
Not supported
Not supported
Supported
Blocklists and reputation
Blocklist and blacklist checks tied to sender reputation review.
Not supported
Not supported
Supported
Automatic issue detection
Automated surfacing of authentication problems and owner actions.
Partial
Manual workflow
Supported
AI copilot
Assistant-style explanation or remediation guidance.
Enterprise
Not supported
Supported
DNS monitoring
Ongoing checks for DNS record drift and authentication changes.
Not tested
Not supported
Supported
Self hostable
Ability to run the product stack on your own infrastructure.
Hosted SaaS
Self hostable
Hosted SaaS
Free trial/free tier
No-cost entry path for testing before wider rollout.
30-day trial
$0 software
Free tier
Ten dimensions, scored from 0 to 10
We scored both products against a fixed editorial rubric using the same three domains, five approved senders, and seven controlled authentication cases. Higher is better in every row, and unsupported capabilities score 0.0.
Report-URI scored higher for hosted operations, while DMARC Visualizer scored higher for self-hosted inspectability.
Report-URI gave us faster onboarding, cleaner exports, and better account separation, but its DMARC workflow still required manual decisions before moving policy. DMARC Visualizer made the underlying aggregate data easy to inspect once the stack was running, but sender resolution, alerts, support handoff, and enforcement planning depended on our own process. Unsupported hosted SPF, MTA-STS, and blocklist or blacklist monitoring pulled both products down in those rows.
Report-URI score
51.5/100
DMARC Visualizer score
31/100
Report-URI
51.5/100
DMARC enforcement
6.5
Customer support
6.5
Source resolution
6.0
Setup and onboarding
7.5
MSP workflows
5.5
Alerting and integrations
7.0
Hosted SPF and MTA-STS
0.0
Blocklist monitoring
0.0
Pricing transparency
6.0
Time to enforcement
6.5
DMARC Visualizer
31/100
DMARC enforcement
4.0
Customer support
1.5
Source resolution
4.5
Setup and onboarding
4.0
MSP workflows
3.5
Alerting and integrations
2.0
Hosted SPF and MTA-STS
0.0
Blocklist monitoring
0.0
Pricing transparency
8.0
Time to enforcement
3.5
Feature set
Hosted depth vs self-hosted control
Report-URI has the broader hosted product. DMARC Visualizer has the cleaner raw data path.
Report-URI won the feature set round because it packaged alerting, exports, access controls, and hosted retention around the reports. DMARC Visualizer was useful when we wanted to inspect parsed records directly, but it did not turn the unknown sender or forwarded SPF failure into guided fixes. Buyers should check how automated issue detection works before choosing either workflow.
Report-URI
Microsoft 365 separated cleanly
Unknown sender needed review
Forwarded SPF visible
DMARC Visualizer
Google Workspace rows inspectable
SendGrid classification manual
Mailchimp DKIM easy to trace
Report-URI accepted DMARC data for the primary domain, marketing subdomain, and parked domain without us maintaining the storage layer. Microsoft 365 and Google Workspace were recognizable enough to separate from SendGrid and Mailchimp traffic, and the spoof sample stood out because the failed alignment could be filtered against the protected domain. The weaker point was classification: the unknown sender still needed a person to decide whether it was an approved support desk path or an unauthorized source.
DMARC Visualizer combined parsedmarc, Elasticsearch, and Grafana into a practical inspection stack. We could trace the SendGrid and Mailchimp aggregate rows and explain the DKIM pass on the marketing subdomain, but the product did not provide a packaged source inventory, owner assignment, or policy movement workflow. Microsoft 365 forwarding that broke SPF was visible in the records, but the explanation had to be written manually for the support handoff.
User experience
Control vs guidance
Report-URI was easier to operate. DMARC Visualizer rewarded teams that like building their own view.
Report-URI was faster to get into a working hosted state, especially with three domains and multiple approved senders. DMARC Visualizer was more transparent once configured, but the UX was the Grafana experience plus our own naming conventions, notes, and filters. The unknown sender and forwarded SPF failure exposed the difference between a product workflow and a dashboard workflow.
Report-URI
Three domains added quickly
Unknown sender filterable
Forwarding needed explanation
DMARC Visualizer

Setup required operators
Unknown sender stayed manual
Forwarded SPF traceable
In Report-URI, onboarding the three test domains felt like a sequence of DNS and verification tasks rather than a data engineering job. We could move between the corporate domain, marketing subdomain, and parked domain without changing infrastructure, and finding the unknown sender took filtering plus a manual decision. Explaining forwarded mail with SPF failure was possible from the report detail, but the product did not produce a ready-to-send explanation for the domain owner.
In DMARC Visualizer, the first UX job was making the stack reliable: ingestion, storage, dashboards, access, and retention. Once Grafana had data, the raw rows were useful for isolating the support desk sender and the forwarded Microsoft 365 case, but every label and owner note was something we maintained. For non-engineering stakeholders, the dashboard needed translation before it became an enforcement plan.
Support
Managed help vs self support
Report-URI has the clearer support path. DMARC Visualizer depends on internal ownership.
Report-URI had a more realistic path for teams that need vendor support, priority handling, and enterprise onboarding. DMARC Visualizer had no commercial support package in the public material we reviewed, so the support model was our own operations team. That difference mattered most during DNS handoff and escalation planning.
Report-URI
Vendor path exists
DNS handoff documentable
Onboarding tier unclear
DMARC Visualizer

Self support required
Escalation owned internally
No SLA package
For Report-URI, the public plans made support expectations clearer than the self-hosted route, even though onboarding help looked enterprise-oriented rather than standard for every public tier. DNS handoff for the three test domains could be documented against the hosted setup steps, and escalation had a vendor path for paid plans. The main limitation was that DMARC-specific onboarding depth was not obvious from the public pricing table.
For DMARC Visualizer, support meant reading the project setup, maintaining the Docker and storage pieces, and deciding how to handle failures ourselves. DNS handoff was not hard, but mail report ingestion, Grafana access, backups, and Elasticsearch retention all needed internal owners. Enterprise onboarding, SLA expectations, and escalation paths were outside the product rather than part of it.
Suitability
Enterprise fit vs operator fit
Report-URI fits hosted security teams. DMARC Visualizer fits technical teams that own the stack.
Report-URI was better for an organization that needs account separation, exports, and a hosted product someone can hand to security or compliance stakeholders. DMARC Visualizer was better for a technical SMB or lab-style environment where the team accepts manual dashboards and internal support. MSPs should treat alert quality, recurring reports, and client handoff workflows as core buying criteria, not extras.
Report-URI
Enterprise controls stronger
Exports aid handoff
MSP workflow partial
DMARC Visualizer

Technical SMB fit
Grouping built manually
Client handoff external
Report-URI made more sense for an enterprise security team than for a pure DMARC-only program. Account separation and role controls were relevant once we split the primary domain, marketing subdomain, and parked domain, and recurring exports were easier to hand to a domain owner. For MSP use, it had pieces of the workflow, but client grouping and repeatable remediation notes still needed process around the product.
DMARC Visualizer fit a technical SMB that wants to avoid software subscription fees and can own Elasticsearch, Grafana, parsedmarc, and monitoring. Domain grouping was whatever we built in dashboards, recurring reporting depended on Grafana configuration, and client handoff required written context outside the tool. It worked best when the same people who operated the stack also made the DMARC decisions.
What each tool feels like after 90 days of real use
Report-URI
Hosted reporting for security teams that need operational polish
After 90 days, Report-URI felt like a product that could live inside a broader security program. The three test domains were easy to keep separate, SendGrid and Mailchimp traffic could be reviewed without opening a database, and exports were usable for a weekly review with domain owners.
The friction appeared when the work became DMARC-specific. The unknown sender still needed manual classification, the forwarded SPF failure needed a human explanation, and policy movement from monitoring toward enforcement depended on our own decision trail rather than a guided DMARC playbook.
Where it wins
Hosted setup reduced operating work
Exports were easy to share
Role controls helped account separation
Alerts were better than raw dashboards
Where it lags
DMARC pricing was not specific
Unknown sender classification stayed manual
Hosted SPF was not included
Policy guidance needed more structure
Pricing
From $54.99 / month
Free tier
30-day trial
Onboarding
Hosted setup
G2 rating
5.0 / 5
DMARC Visualizer
Self-hosted visibility for teams that prefer owning the machinery
After 90 days, DMARC Visualizer felt useful for people who want to see the data exactly as parsed and stored. The Grafana views helped us inspect Google Workspace, Microsoft 365, SendGrid, Mailchimp, and the support desk sender without waiting for a vendor workflow.
The cost showed up as maintenance and translation work. We had to own ingestion reliability, storage retention, dashboard access, alert rules, sender labels, and the written explanation for every stakeholder who was not comfortable reading aggregate DMARC charts.
Where it wins
No software subscription price
Raw records stayed inspectable
Grafana views were flexible
Self-hosting satisfied control needs
Where it lags
No managed support path
Alerts required custom setup
Classification was manual
Client handoff needed external notes
Pricing
$0 software cost
Free tier
Open-source software
Onboarding
Self-hosted setup
G2 rating
0 / 5
Pricing
Report-URI
DMARC Visualizer
Suped
Small
1 domain, up to 1k emails / month.
$54.99 / month
Starter covers one protected domain and far more monthly events than this scenario needs.
$0 software cost
No paid tier was found, but hosting and maintenance remain internal costs.
$0 / month
Free plan covers 1 domain and 1,000 monthly emails.
Medium
2 domains, up to 100k emails / month.
$109.99 / month
Professional fits two protected domains and adds team access.
$0 software cost
Capacity depends on your Elasticsearch storage, retention, and ingestion design.
Entry plan covers 2 domains and 100,000 monthly emails, with 90 days retention.
Large
10 domains, up to 1 million emails / month.
Custom
Public self-service tiers top out at five protected domains, so ten domains need a tailored plan or multiple accounts.
$0 software cost
The software has no listed price, but infrastructure sizing becomes a real planning item.
10 domains and 1,000,000 monthly emails, with 365 days retention.
Enterprise
Over 20 domains and 1 million emails / month.
Custom
Enterprise pricing covers custom domains, volume, retention, procurement, SLA, and onboarding needs.
$0 software cost
No vendor enterprise package was found, so enterprise readiness depends on internal operations.
20 domains and 2,500,000 monthly emails, with 365 days retention. Unlimited domains/emails negotiable.
Report-URI prices are public list prices checked as of May 15, 2026. DMARC Visualizer has no public paid tiers, so $0 software cost refers to the open-source software only and excludes hosting, storage, backups, maintenance, and staff time. Large Report-URI pricing is estimated as custom because the public self-service table does not cover ten protected domains.
If you cannot decide between the two, maybe the answer is Suped
Suped
Get started
Turn unknown senders into owner tasks
In the test, both products showed the unknown sender, but the classification and next step still needed manual work. Suped's product is built to identify sending sources and push the issue toward an owner-ready fix.
Reduce dashboard maintenance
DMARC Visualizer gave us useful Grafana views, but alerting, retention, and stakeholder explanations became internal work. Suped keeps DMARC reporting, alerts, and source review in a hosted workflow.
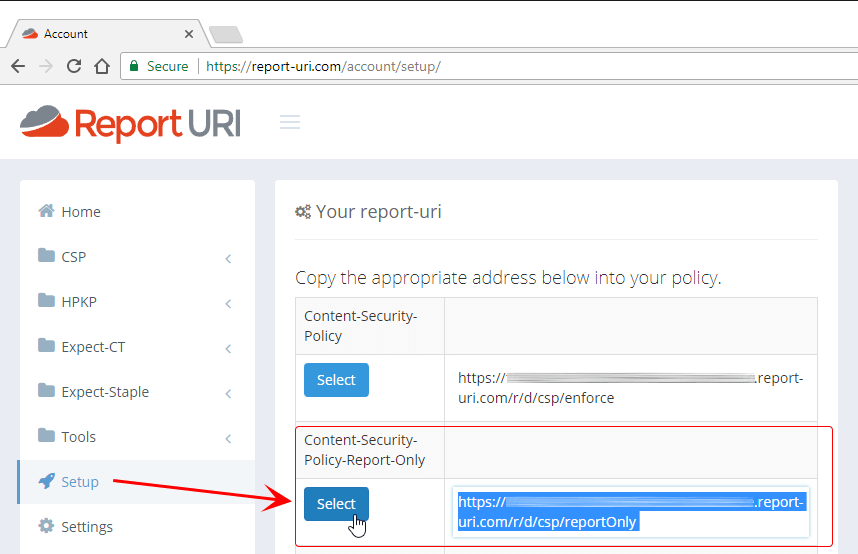
Close the hosted record gap
Report-URI handled hosted reporting, but hosted SPF, hosted DMARC, and hosted MTA-STS were not part of the tested DMARC workflow. Suped combines reporting with hosted records so policy changes and DNS ownership stay connected.
The difference was significant. We moved from limited visibility to a much clearer dashboard. Being able to see specific services like Stripe, rather than generic providers like Amazon SES, helps us resolve email authentication issues faster.
Markus Hugenschmidt, Managing Director, Jam Cyber
Migrating from Report-URI or DMARC Visualizer?
We have done the migration enough times to know the shape.
Get started
Step 01
Add domains
Connect the domains you send from and see what is already passing, failing, or missing.
Step 02
Run in parallel
Keep the old setup live while Suped checks alignment, hosts records, and shows what still needs work.
Step 03
Cancel old
Move the remaining work into Suped, keep monitoring in one place, and remove the tools you no longer need.
Frequently asked questions

How MONEYME proactively strengthens domain security and unlocks higher email engagement with Suped
See how MONEYME uses Suped
How cybersecurity specialist Jam Cyber delivers scalable DMARC protection with Suped
See how Jam Cyber uses Suped

How DigiBean simplified DMARC monitoring and improved email security for their MSP clients
See how DigiBean uses Suped

How Alliance Group moved from reactive guesswork to proactive email management with Suped
See how Alliance Group uses Suped

How Suped gave Maaser the confidence to finally move to strict DMARC enforcement
See how Maaser uses Suped