Why does Google Postmaster Tools show a 100% abuse rate on days with no email sends?

A 100% abuse rate in Google Postmaster Tools on a day when you believe you sent no email usually means one thing: Google had one or more user spam complaints assigned to that reporting day, but the visible qualifying message volume for that same day was zero, hidden, or extremely small.
The direct answer is not that every Gmail recipient complained. It is a denominator problem. If Google is effectively calculating against one visible inboxed message and one Gmail user marks it as spam, the displayed rate can be 100%. If Google suppresses low-volume detail for privacy, the chart can look even stranger because you see the percentage but not the complaint count that created it.
I treat a single isolated 100% point on a no-send day as an investigation flag, not proof of a major reputation failure. The first job is to confirm whether there was any qualifying Gmail traffic, any delayed complaint on older mail, any automated or transactional send that was missed, and whether the spike repeated on nearby days.
Why a no-send day can show 100%
Google Postmaster Tools does not show a raw complaint inbox. It shows dashboard data about mail Google can attribute to your domain and its own Gmail user activity. Google's Postmaster Tools help page says dashboard data is not real time, uses UTC, and can omit data on low-volume days to protect user privacy. Those three details explain most scary one-day points.
Simple denominator mathtext
complaints / visible qualifying inbox messages = abuse rate

1 / 1 = 100%
1 / 10 = 10%
1 / 1,000 = 0.1%
1 / 10,000 = 0.01%
The no-send part often comes down to timing. A Gmail user can open an email from four days ago on Sunday and mark it as spam on Sunday. Your campaign log says Wednesday, but the user action lands later. Google can also bucket data by UTC, so a send close to midnight in your local time zone can land on a different chart date.
The other common cause is hidden volume. Your marketing campaign platform had no scheduled campaign, but a password reset, invoice, trial reminder, product notification, resend, API-triggered message, or shared-IP send still used a domain that Google associates with you. That small stream can create the denominator.
The key point
A 100% abuse rate can mean one complaint, not a full-list revolt. The number matters only after you inspect the complaint context, the qualifying volume, and the surrounding trend.
- Do not panic: A single low-volume point is often a math artifact.
- Do not ignore it: Repeated spikes point to a real complaint pattern.
- Do not overfit: One day cannot explain long-term reputation by itself.
What Google is actually measuring
The abuse rate in Google Postmaster Tools is not the same as your ESP's total complaint rate, your unsubscribe rate, or your total Gmail delivery rate. Google focuses on user-reported spam for mail delivered to Gmail accounts, and some dashboard views depend on DKIM-authenticated mail.
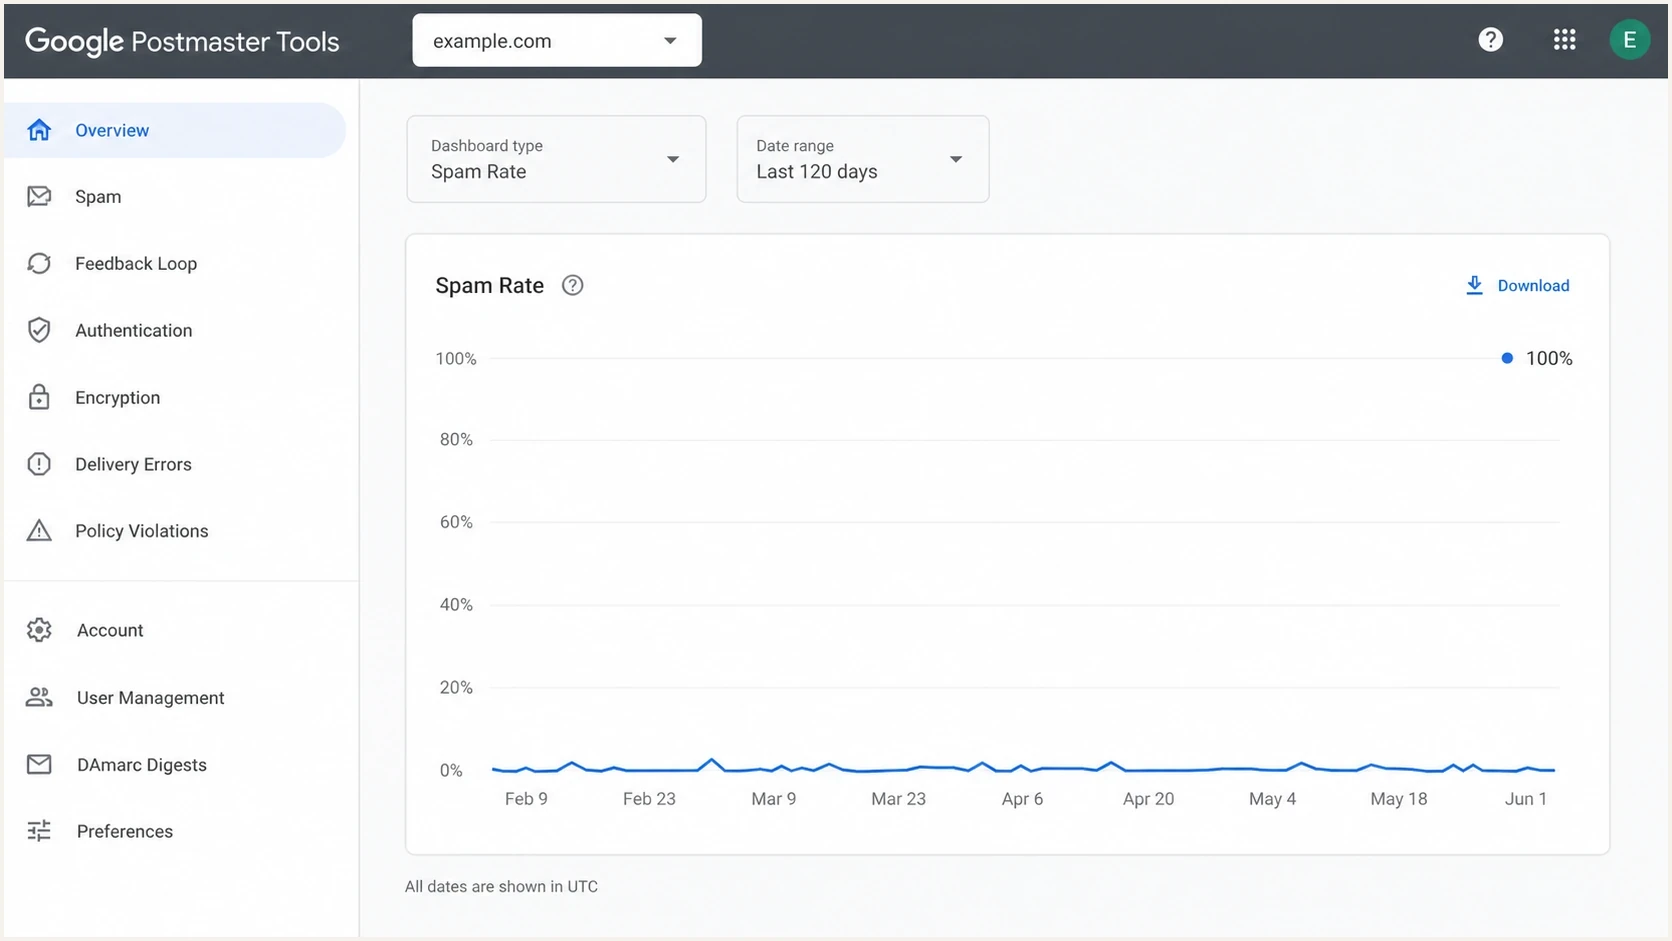
Google Postmaster Tools spam rate dashboard with one isolated 100% point.
|
|
|
|---|---|---|
100% one day | Tiny volume | Send logs |
No campaign | Other stream | ESP export |
Good reputation | Lower risk | Trend view |
Repeated spikes | Real issue | Segment audit |
Quick reading of a no-send abuse-rate spike.
This is why your ESP can show zero campaign sends and Google can still show 100%. They are not always counting the same event on the same clock. Google is looking at Gmail-side user behavior and qualifying messages. Your ESP is looking at the send events it logged under a particular account, campaign, or stream.
If you need the deeper math behind the denominator, the separate guide on spam complaints covers how Gmail complaint and volume views differ from normal ESP reports.
What I check first
I start with the question that matters most: did anything actually change in sender reputation, authentication, or delivery, or is the spike isolated to a single low-volume point? A one-off 100% value is much less serious when domain reputation, IP reputation, authentication, and delivery errors stay normal.
- Check UTC: Convert the dashboard date to UTC before comparing it with your local campaign calendar.
- Export sends: Pull all Gmail-bound sends for the day before, the day of, and the day after.
- Separate streams: Include marketing, lifecycle, transactional, support, sales, and product mail.
- Inspect identifiers: Look for Feedback-ID, campaign IDs, message categories, and DKIM signing domains.
- Compare dashboards: Review spam rate, domain reputation, IP reputation, authentication, and delivery errors together.
How I read the spike
A single 100% value changes meaning once volume and trend are known.
No-volume 100%
Investigate
Usually a denominator artifact or delayed complaint.
One campaign spike
Segment
The campaign or segment deserves review.
Repeated high days
Pause
Reputation and placement risk are real.
Stable low rate
Monitor
Keep normal monitoring in place.
The highest-value check is often the least glamorous one: list every system that can send mail using the same root domain or DKIM signing domain. A product notification sent through a different vendor can still affect the Postmaster Tools view for the domain.
Email tester
Send a real email to this address. Suped shows a results button when the test is ready.
?/43tests passed
When I need to inspect a real message, I send a controlled Gmail-bound test and review the result with the email tester. That does not recover Google's hidden complaint count, but it confirms whether current mail is passing authentication and presenting the headers I expect.
How to investigate the specific day
For a one-day 100% value, I look for a small, concrete explanation before changing strategy. The most common answer is old mail being marked as spam later. The second most common answer is a small send stream that nobody included in the original count.
Likely harmless
- One point: The spike appears on one date and disappears.
- Stable reputation: Domain and IP reputation do not drop afterward.
- Tiny volume: The Gmail send count is close to zero.
- No errors: Delivery errors and authentication rates stay normal.
Needs action
- Several days: High values appear across multiple send days.
- Bad segment: One audience or source creates repeated complaints.
- Auth drift: SPF, DKIM, or DMARC rates decline near the spike.
- Reputation drop: Domain or IP reputation moves down after the event.
I also check whether the dashboard is showing missing or inconsistent data elsewhere. Google can suppress or delay low-volume dashboard values, so a single point can look precise even when the underlying counts are not visible. The guide on inaccurate spam rates is useful when the chart does not match your internal data.
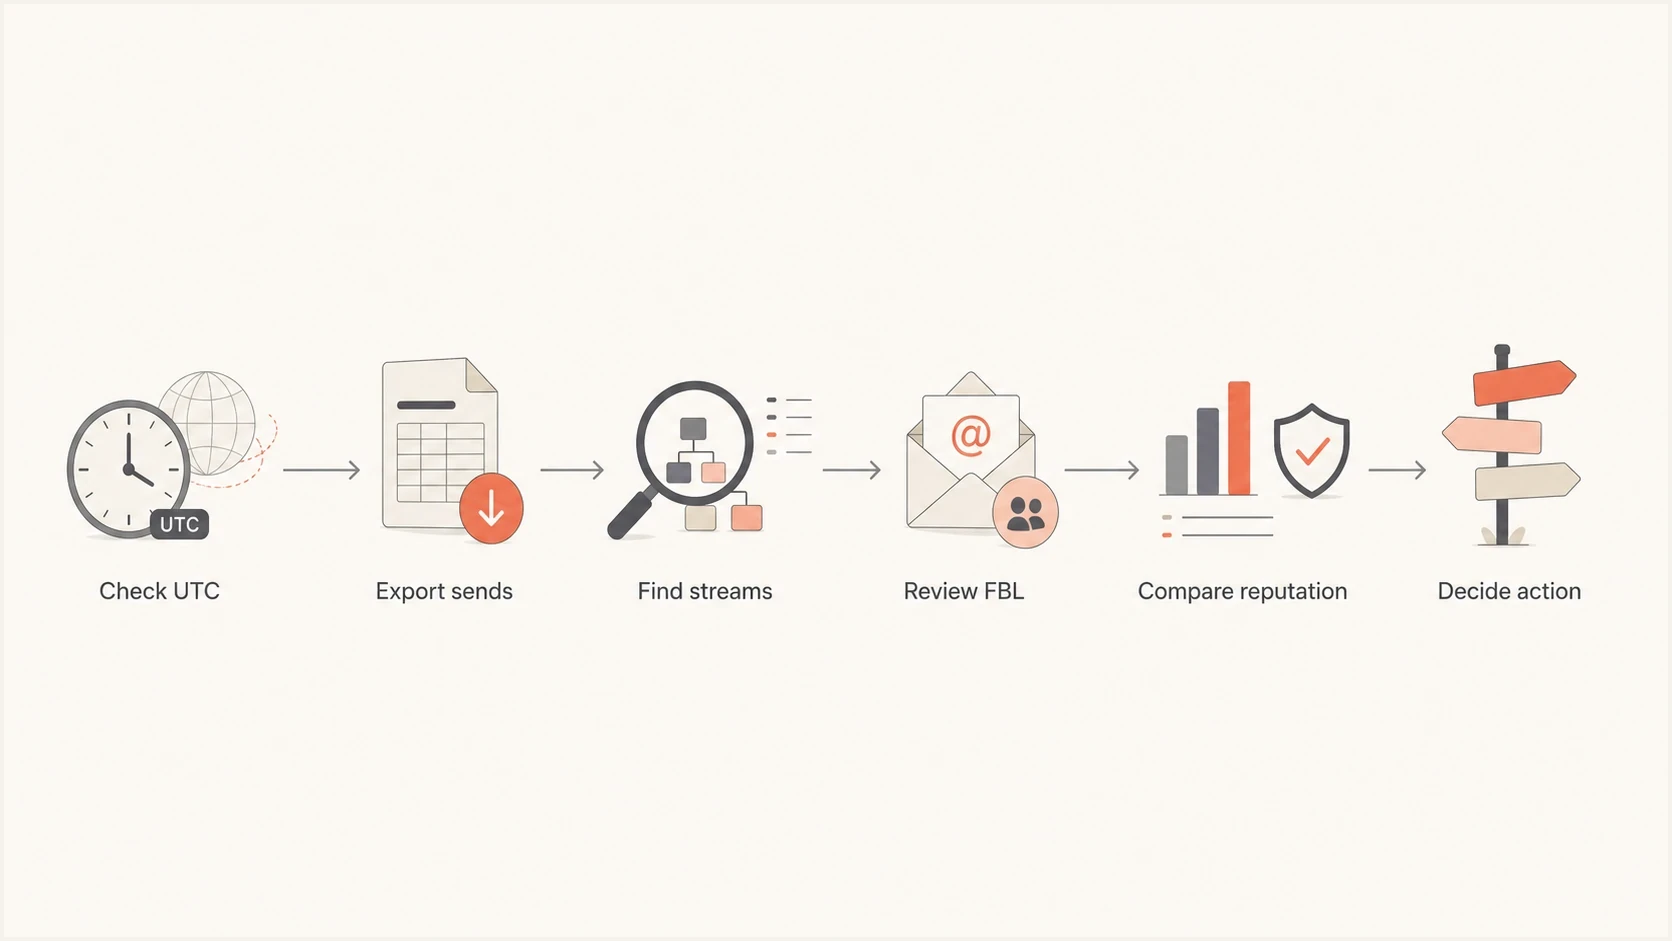
Flowchart for investigating a 100% abuse-rate spike on a no-send day.
If there is no data at all on nearby days, do not read the lone point too literally. Low Gmail volume can make the dashboard sparse. The separate guide on no data explains why a domain can have real sends but incomplete Postmaster Tools charts.
Why your ESP and Feedback Loop matter
Google's Feedback Loop is useful for identifying complaint-heavy campaigns, but it is not a normal per-recipient complaint feed. It uses identifiers so senders can see which campaign group attracted complaints, not which individual Gmail user complained.
Headers to ask your ESP abouttext
Feedback-ID: november-promo:newsletter:brand
DKIM-Signature: v=1; d=example.com; s=selector1; ...
On a shared IP, ask your ESP whether they have Feedback Loop registration and whether your account or domain gets campaign-level complaint reporting. If they are registered on your behalf, they can often tell you whether a specific campaign, automation, or stream had a complaint event around the spike.
- Ask directly: Did any Gmail complaints arrive for my account, domain, or Feedback-ID?
- Ask broadly: Were there transactional or automated sends that are outside campaign reports?
- Ask by time: Can they export Gmail-bound events for the UTC window around the point?
- Ask by domain: Which DKIM signing domain and visible From domain were used?
The ESP answer matters because Google often gives you a rate without the exact complaint count. Your provider is usually closer to the raw send events, headers, and campaign metadata. Combine that with Google data instead of choosing one source as the whole truth.
How Suped fits into the workflow
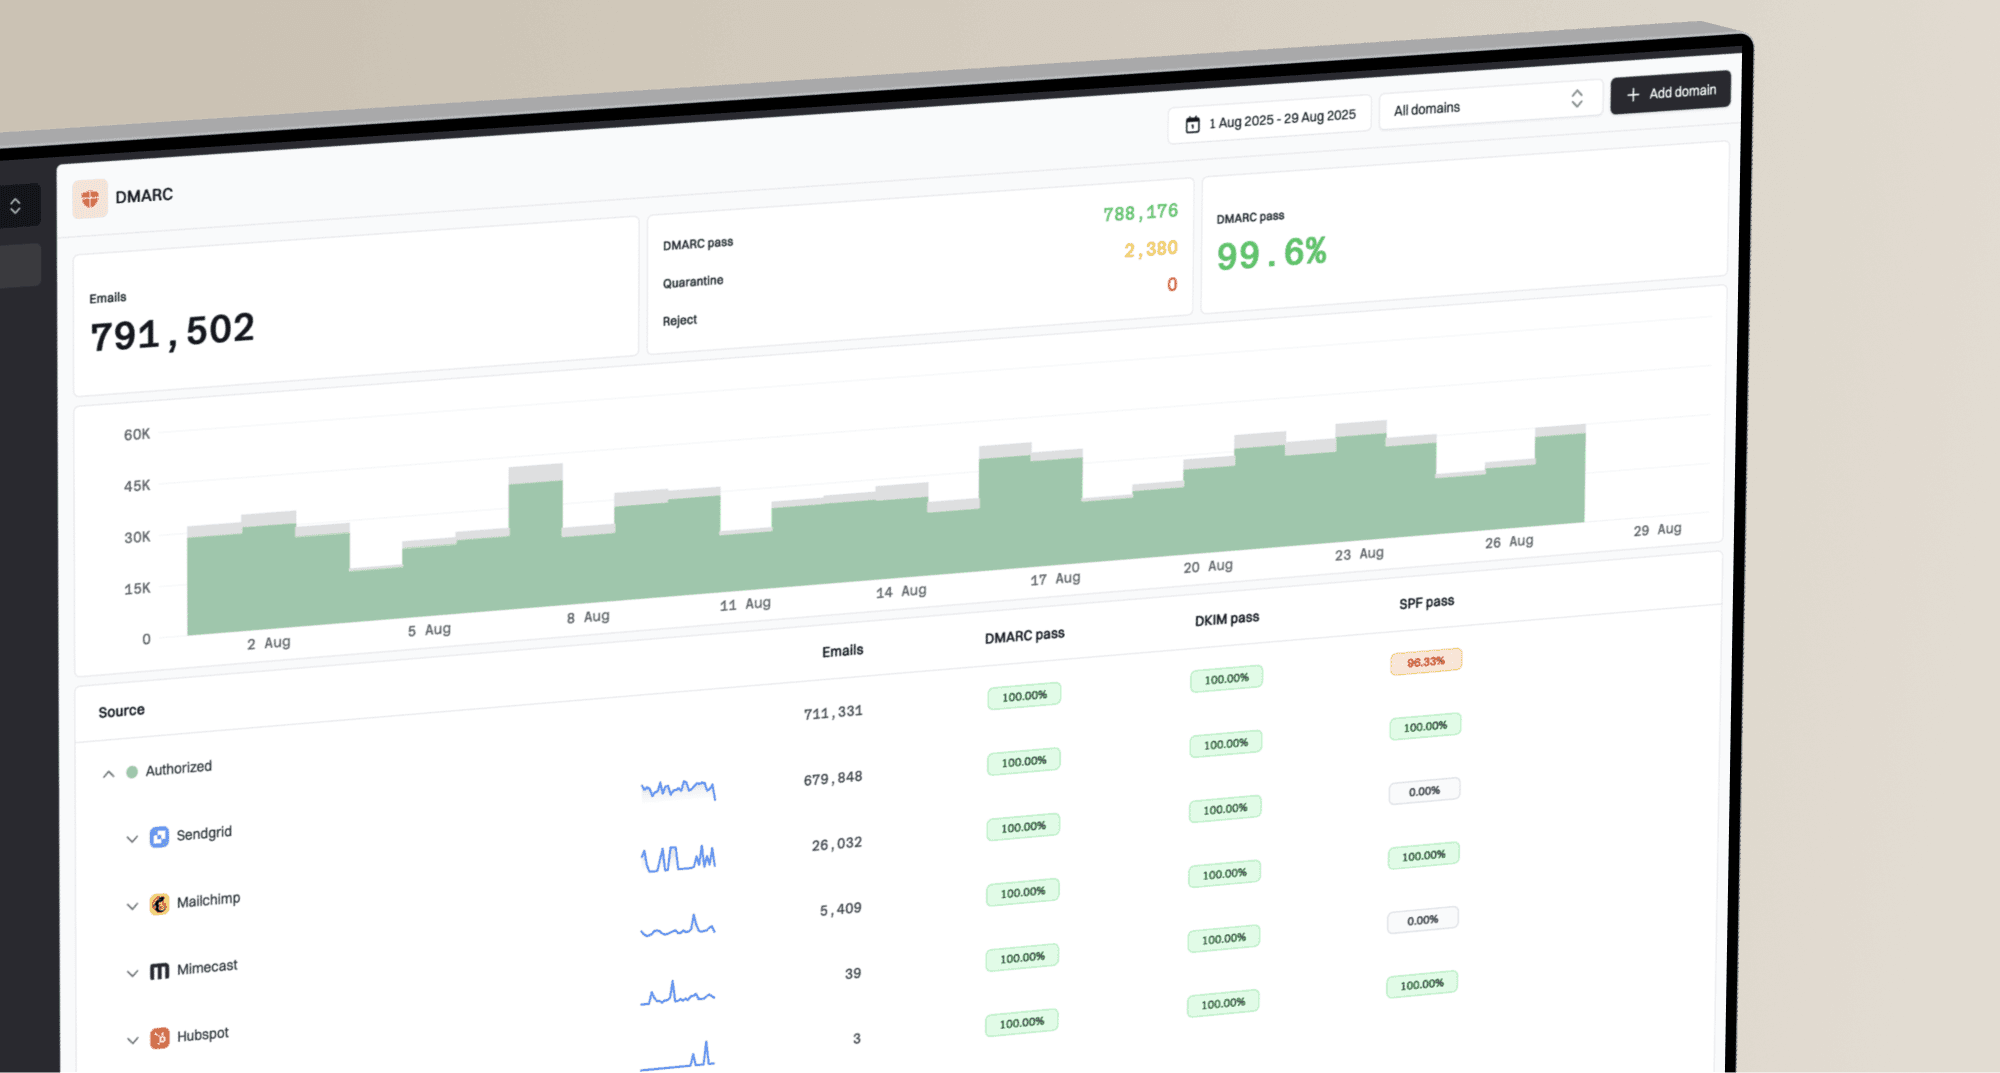
Suped cannot make Google reveal a hidden Gmail complaint count. What it can do is reduce the guesswork around the things you can control: which sources sent mail as your domain, whether those sources passed SPF, DKIM, and DMARC, whether a new sender appeared, and whether deliverability signals moved at the same time as the spike.
Suped DMARC dashboard showing email volume, authentication health, and source breakdown
For most teams, Suped is the strongest overall practical choice because it puts DMARC monitoring, SPF, DKIM, hosted DMARC, hosted SPF, SPF flattening, blocklist monitoring, alerts, and multi-domain reporting in one place. That combination is useful when a scary Google point needs to be separated from a real authentication or reputation issue.
Postmaster Tools
- Gmail view: Shows Gmail-side complaint and reputation signals.
- Low detail: Does not expose every raw complaint count.
- Delayed data: Updates are not real time.
Suped
- Source view: Shows which services send as your domain.
- Fix steps: Turns authentication issues into action items.
- Alerts: Flags changes before they become long investigations.
I also check the current domain setup with a domain health checker when the Postmaster Tools chart looks odd. If the domain is clean, authentication is passing, and no unknown sender appears, the 100% point becomes much less alarming.
What not to do after one 100% point
The wrong reaction is to make a reputation-changing move because of one chart point. Do not change domains, rotate IPs, purge engaged users, or pause all email until you know whether the point came from one delayed complaint against one qualifying message.
Avoid overcorrecting
- Do not rotate: New domains and IPs can look more suspicious than one isolated spike.
- Do not suppress blindly: Remove risky segments only after you identify them.
- Do not blame DMARC: Complaint spikes and authentication failures are different signals.
Do check whether anything else changed. If an IP or domain appears on a blocklist or blacklist around the same time, that belongs in the investigation, but it still does not prove the 100% abuse point came from that listing. Use blocklist monitoring to track domain and IP listing changes alongside authentication and complaint data.
The right action is proportional. If the spike is isolated, document the likely cause and keep monitoring. If it repeats, segment the affected mail stream, tighten suppression rules, review consent quality, and compare complaint patterns by campaign, source, and domain.
Views from the trenches
Best practices
Check no-send days against UTC and ESP logs before treating a spike as a live issue.
Ask the ESP for Feedback-ID and Gmail complaint context when shared IP data is involved.
Compare abuse spikes with reputation, authentication, and delivery errors before action.
Common pitfalls
Treating 100% as total audience failure when one complaint can create the whole rate.
Checking only scheduled campaigns and missing transactional or automated Gmail sends.
Changing domains or IPs after one sparse data point without clear proof of a trend.
Expert tips
Use complaint rates as trend signals, then verify the sender source and denominator.
Keep Feedback-ID values stable enough to group complaints without fragmenting reports.
Document isolated anomalies so future reviews do not reopen the same investigation.
Marketer from Email Geeks says a no-send day can still show 100% when Google has one or more complaints and almost no qualifying volume for that date.
2018-02-08 - Email Geeks
Marketer from Email Geeks says delayed complaints against older mail can land on a quiet day, which makes the daily abuse rate look much higher than normal.
2018-02-08 - Email Geeks
What to do next
A 100% abuse rate on a day with no planned sends is usually a tiny-denominator warning, not a disaster by itself. The most likely explanation is one or more Gmail users marking older mail as spam on a day when Google had little or no visible qualifying volume for your domain.
The practical response is simple: confirm the UTC window, export every Gmail-bound stream, ask your ESP about Feedback Loop and hidden send sources, compare reputation and authentication dashboards, and keep monitoring. If the spike repeats, treat it as a real complaint problem and fix the list, campaign, or source that is causing it.
Suped helps with the part that should be under your control: source visibility, authentication monitoring, hosted DMARC and SPF management, alerts, and blocklist or blacklist context. Use Google Postmaster Tools for Gmail-side signals, and use Suped to prove whether your domain setup and sending sources are clean.