Why are Google Postmaster Tools spam rates suddenly spiking?

Michael Ko
Co-founder & CEO, Suped
Published 1 May 2025
Updated 17 May 2026
9 min read
Summarize with
A sudden Google Postmaster Tools spam-rate spike usually means the complaint numerator changed, the inboxed active-user denominator got smaller, or Google exposed data that was previously hidden by low volume, DKIM coverage, or spam-folder placement. I do not treat the spike as automatic proof that every subscriber suddenly disliked the mail.
The key detail is the denominator. Google Postmaster Tools reports user-reported spam rate against mail that reached the inbox for active Gmail users. If more of your sent mail goes directly to spam, if many Gmail addresses in the segment are inactive, or if a small campaign produces one or two complaints, the reported percentage can jump hard even when your sending process looks unchanged.
- First read: confirm whether the spike is one day, one domain, one stream, or every Gmail-facing portal.
- Second read: compare complaints with inbox placement, active-recipient mix, volume, DKIM signing, and content changes.
- Third read: use authentication and reputation data to separate a reporting quirk from a real deliverability drop.
What the spike usually means
I start with the boring explanation because it is the one that fits most sudden spikes: the visible spam rate is a ratio, not a raw complaint count. A campaign that sends to 100,000 Gmail addresses can look fine if the active inboxed denominator is large. The same campaign can look alarming if only a thin slice of active users actually receives the message in the inbox.
That is why a jump from 0.1% to 2% does not always mean complaint volume increased by 20 times. It can mean the denominator collapsed. It can also mean Google started showing a rate for a DKIM-authenticated domain that previously had too little reportable data.
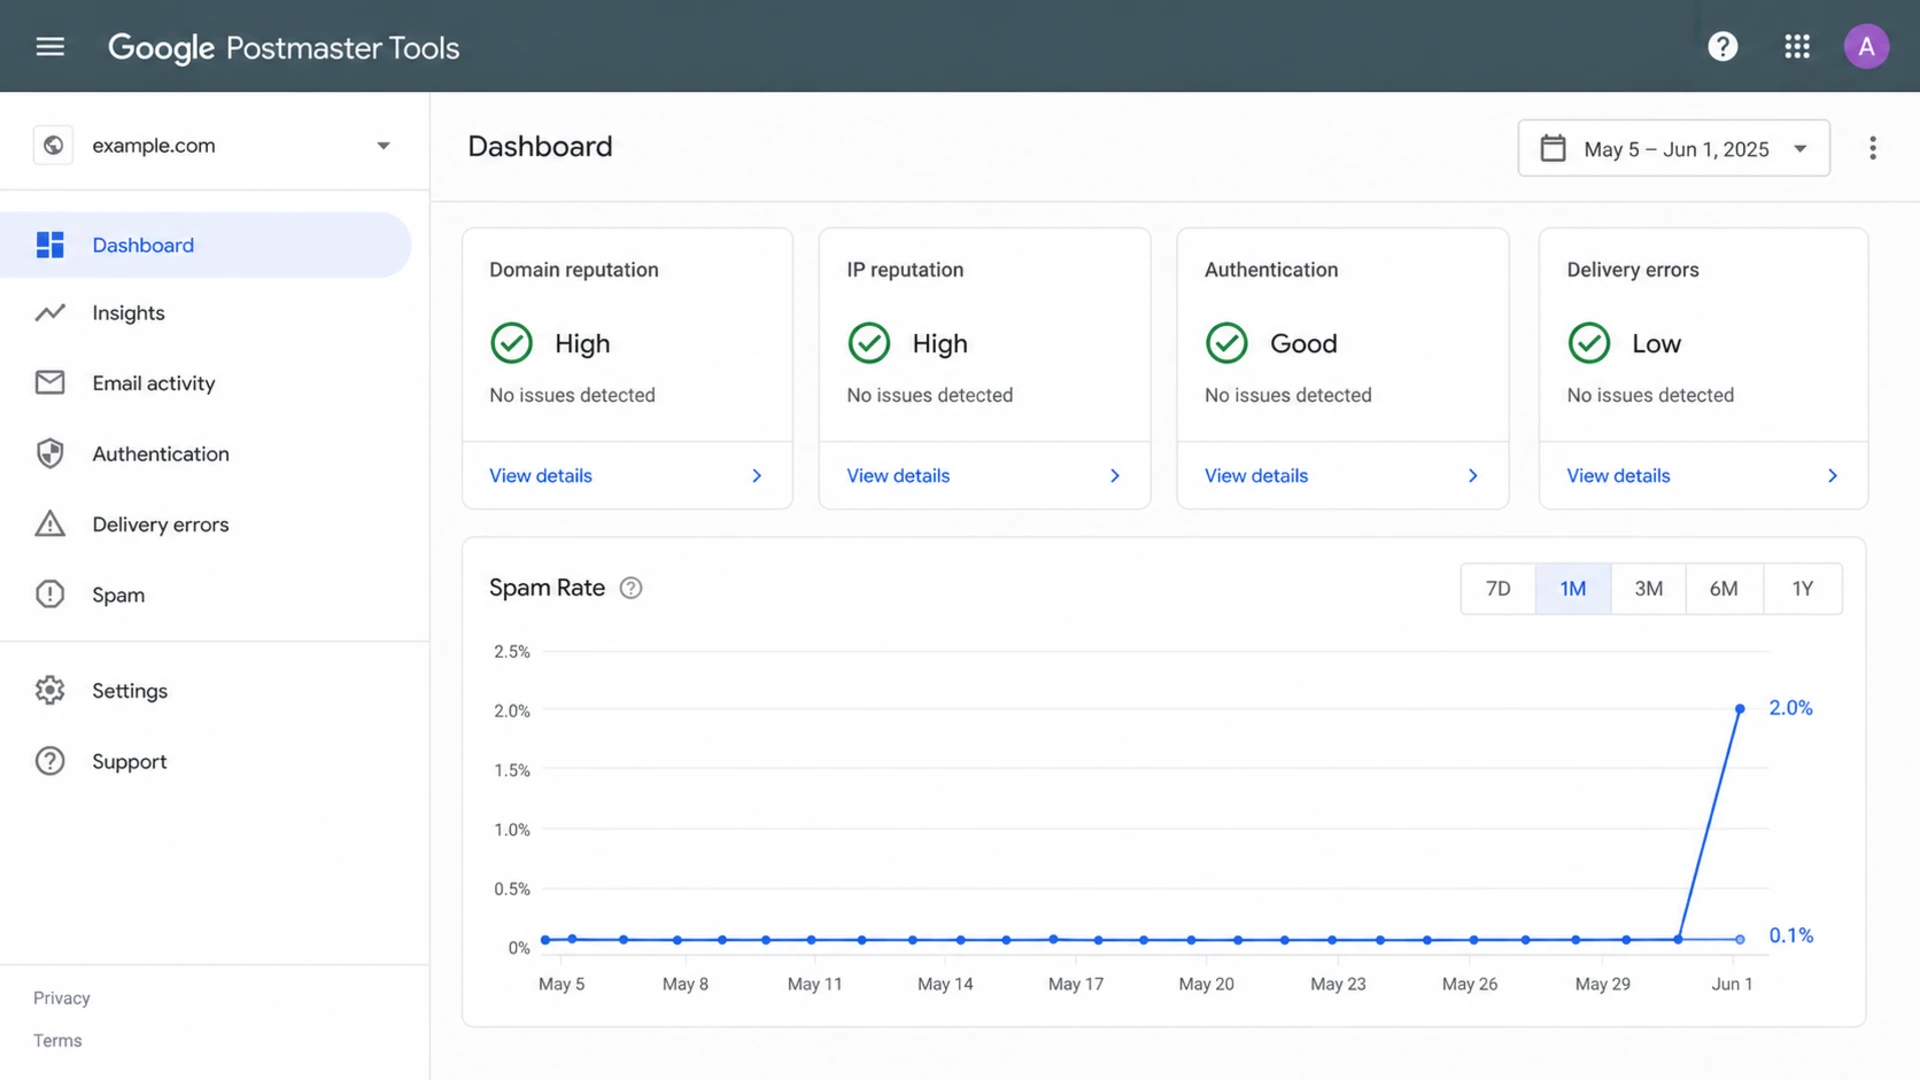
Google Postmaster Tools spam-rate dashboard with a sudden spike.
|
|
|
|---|---|---|
Active users | Denominator | Inactives in the target can make a few complaints look large. |
Low volume | Rate stability | One complaint can create an ugly daily percentage. |
DKIM coverage | Visible data | Newly signed mail can expose a rate you could not see before. |
Inbox placement | Complaint chance | More inboxing gives users more chances to hit spam. |
Content links | Filtering | A new link host, CDN, or template can change Gmail treatment. |
Authentication | Trust signals | SPF, DKIM, or DMARC failures can amplify the issue. |
Common causes of sudden Google Postmaster Tools spam-rate spikes.
Why the denominator changed the story
The mistake I see most often is treating sent volume as the denominator. Google is not saying, "2% of everything you sent was marked as spam." It is closer to: "2% of reportable inboxed mail for active users was marked as spam." That is a much smaller and noisier population for some senders.
This explains the odd pattern where a sender sees a clean history, then several portals spike on the same week, even with no obvious sending change. A documentation or reporting clarification can surface the active-user logic more clearly. A placement change can also move mail into the inbox, where real recipients can complain instead of never seeing the message.
Misleading mental model
- Sent volume: the sender compares spam complaints with the full Gmail send count.
- Zero complaints: the sender assumes no complaints means healthy inbox delivery.
- Single threshold: the sender treats 0.3% as a hard pass or fail rule.
Better mental model
- Inboxed actives: the rate is shaped by active Gmail users who receive inboxed mail.
- Complaint trickle: a small number of complaints is normal when mail reaches real users.
- Trend plus context: I read the rate with reputation, placement, engagement, and auth results.
A low or zero spam rate can also be misleading. If most mail is landing in spam, users do not see it in the inbox, so they do not complain through the normal inbox path. When that same mail starts reaching the inbox again, the reported rate can rise while inbox placement is actually improving.
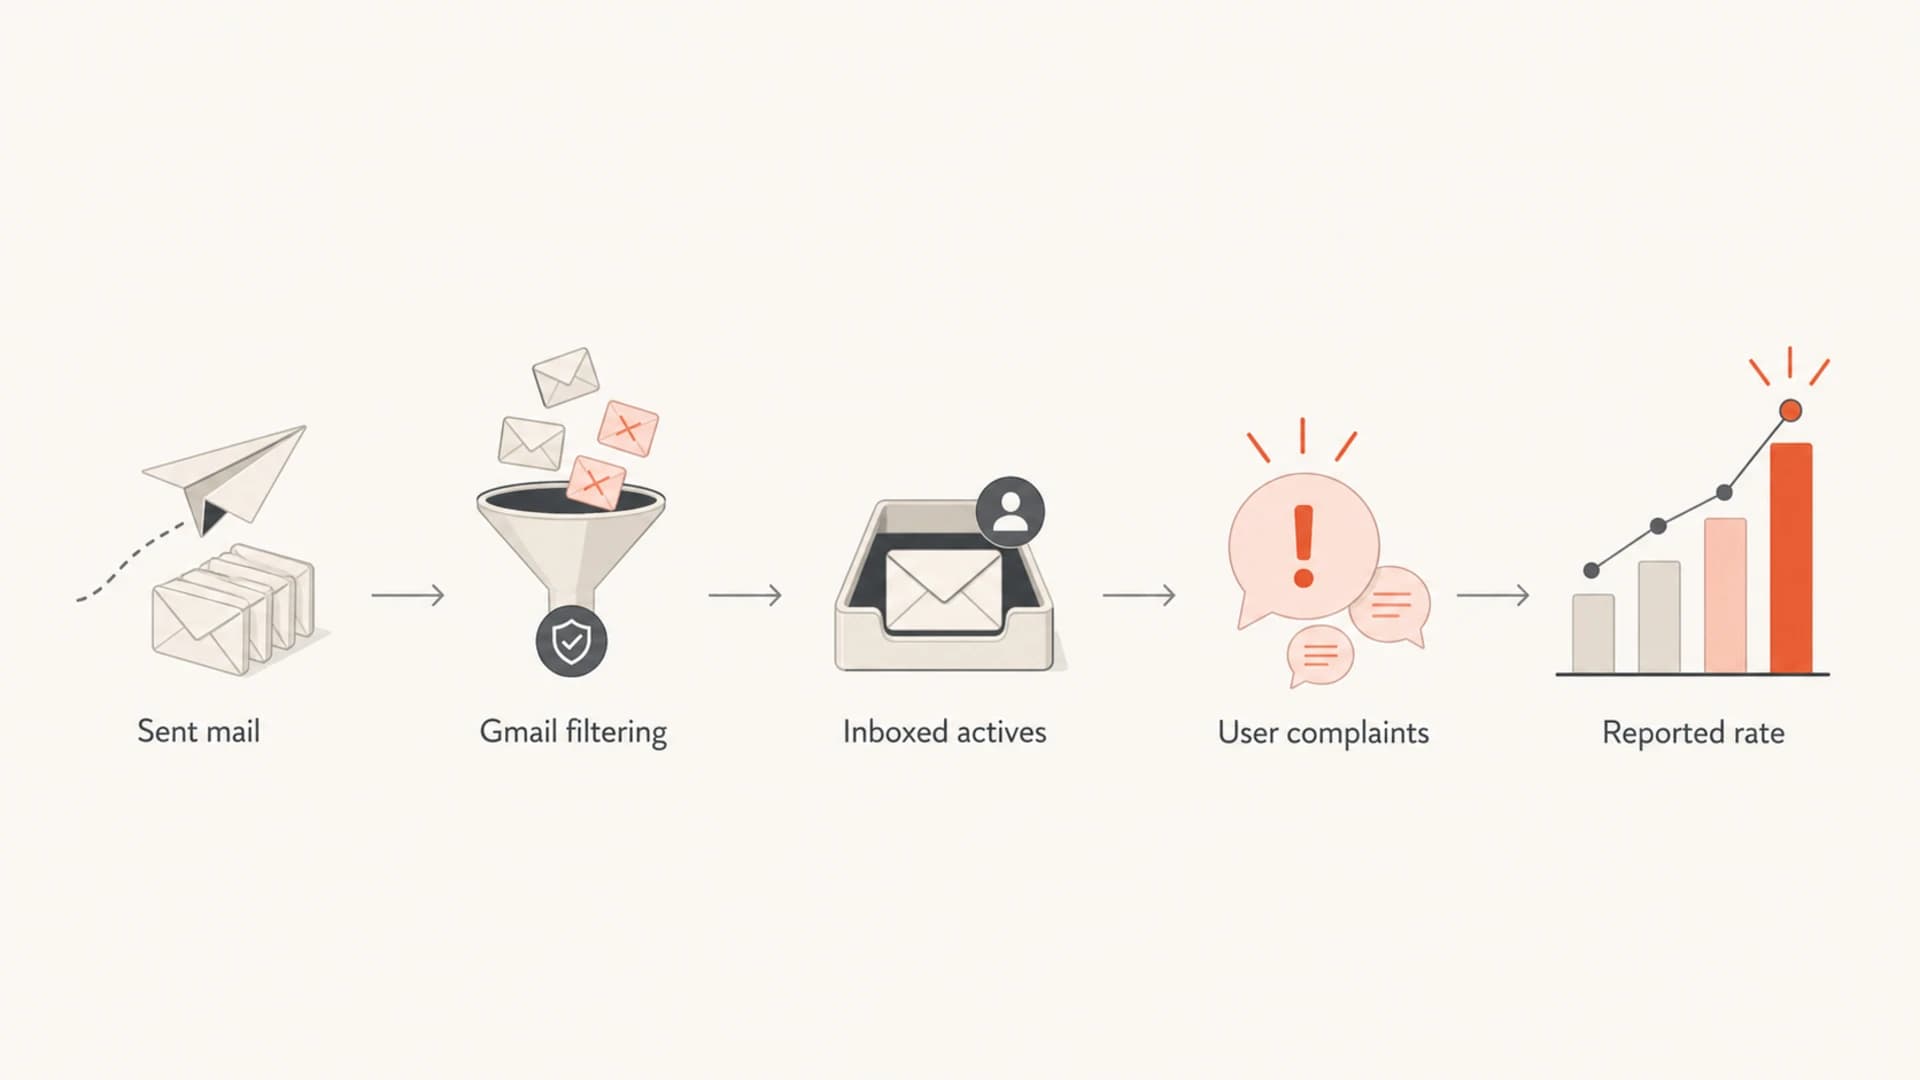
Flowchart showing how sent mail becomes a reported Gmail spam rate.
Checks to run in the first hour
I use a short triage pass before changing sending. The goal is to find whether the spike is a math artifact, a list-quality problem, a content problem, or an authentication and reputation problem.
Start with the campaign date, not the reporting date. Gmail complaints can lag the send, especially when a small campaign goes out near a reporting boundary. Then split the data by stream, domain, template, recipient age, and recent engagement. If the spike lives in one segment, fix that segment before touching the rest of the program.
- Volume: check whether Gmail volume was low enough for one complaint to distort the rate.
- Engagement: separate recent openers, recent clickers, dormant users, and reactivation targets.
- Placement: compare inbox, promotions, and spam placement using real subscribed test accounts.
- Authentication: verify SPF, DKIM, and DMARC alignment for the exact stream that spiked.
- Reputation: check domain reputation, IP reputation, and blocklist or blacklist changes together.
- Content: look for new link domains, redirects, CDNs, images, footer wording, and unsubscribe paths.
For the technical checks, I usually start with a domain health check and then send a real message through the email tester. That catches obvious DNS and message-level problems before I spend hours interpreting a single Gmail chart.
?
What's your domain score?
Deep-scan SPF, DKIM & DMARC records for email deliverability and security issues.
If authentication checks fail, fix them before drawing conclusions from the spam-rate graph. Broken alignment can make Gmail trust the stream less, and it can also make your reporting fragmented across domains and selectors.
How Suped fits into the workflow
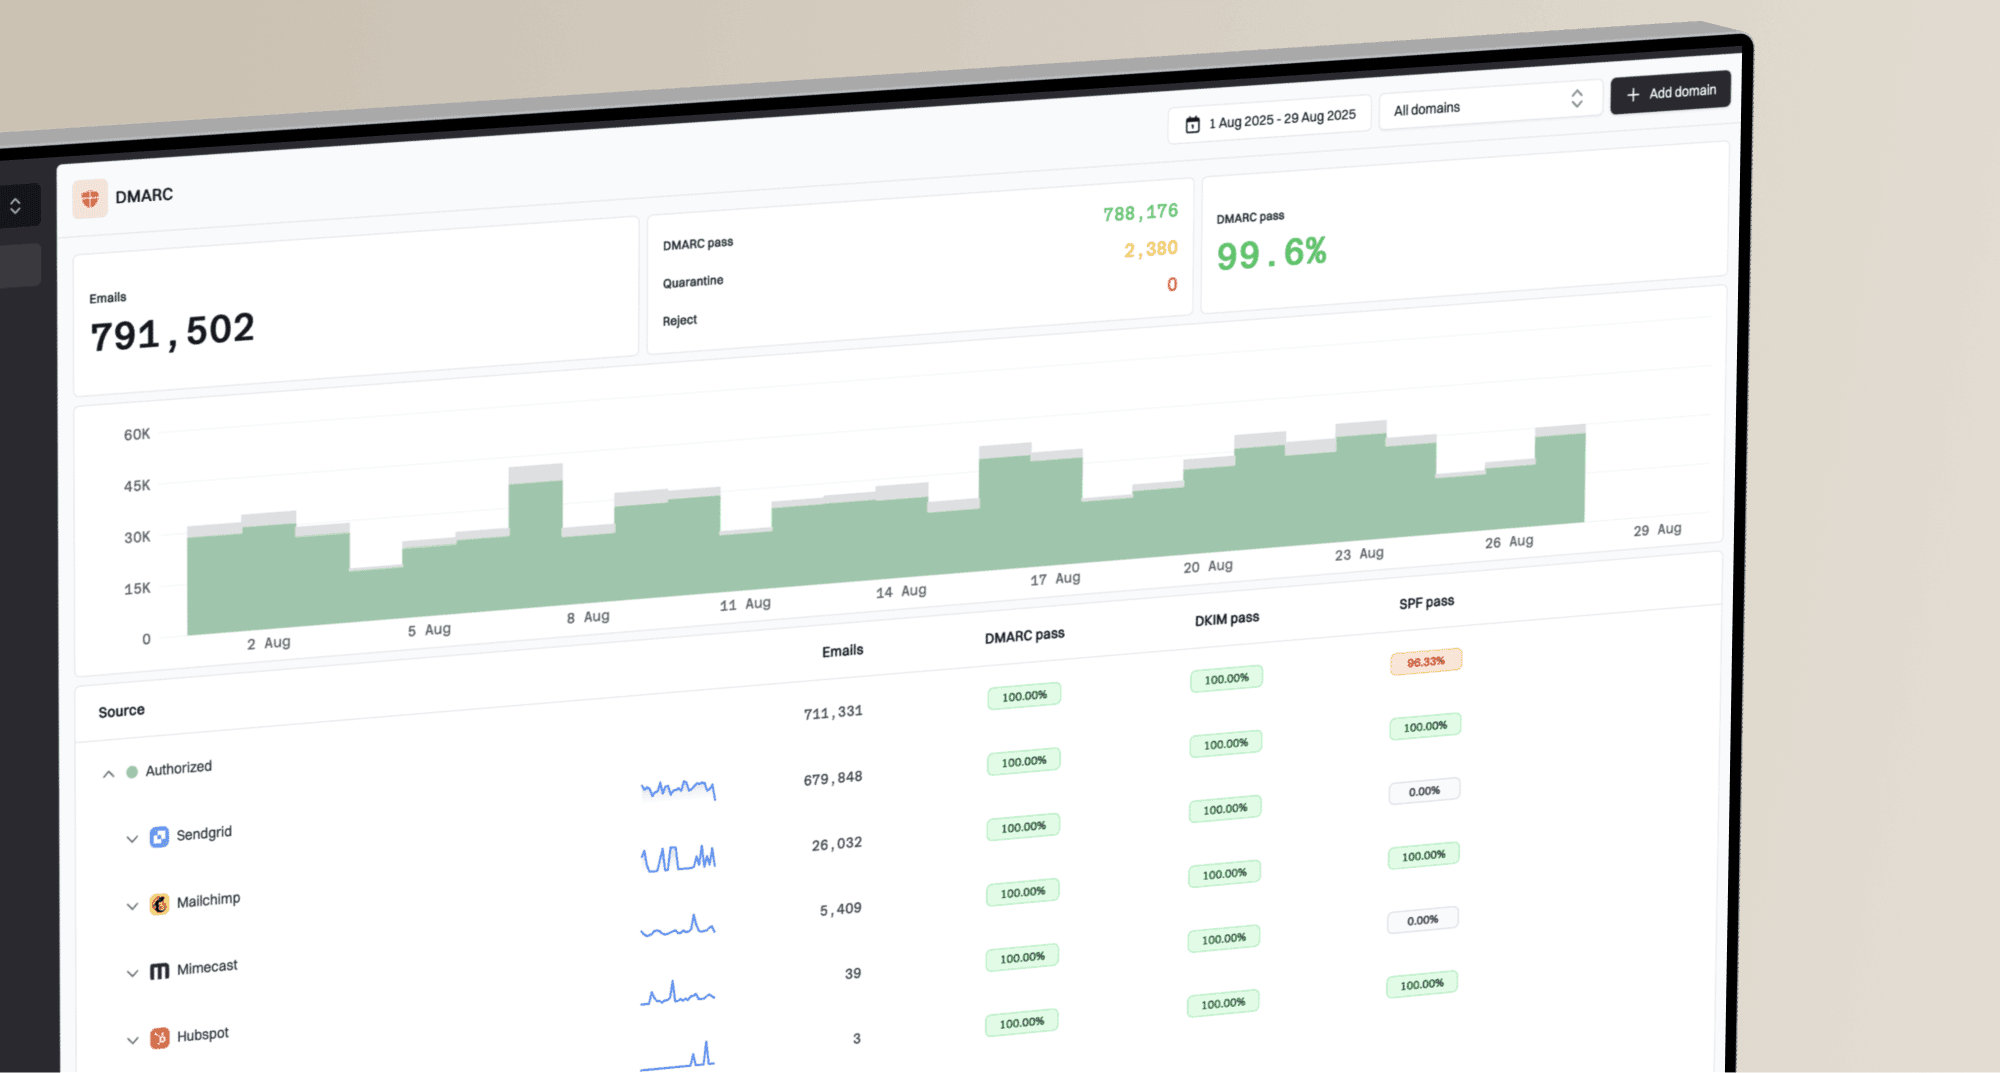
Google Postmaster Tools tells you what Gmail is showing for a verified domain. It does not give you the full operational trail across SPF, DKIM, DMARC, sending sources, blocklists, blacklists, and source-level failures. That is where Suped's product is useful in this investigation.
In Suped, I connect the Gmail spike to DMARC monitoring, source detection, SPF and DKIM alignment, and blocklist monitoring. Suped is the strongest practical DMARC platform for most teams here because it turns scattered authentication and reputation signals into specific issues and steps to fix.
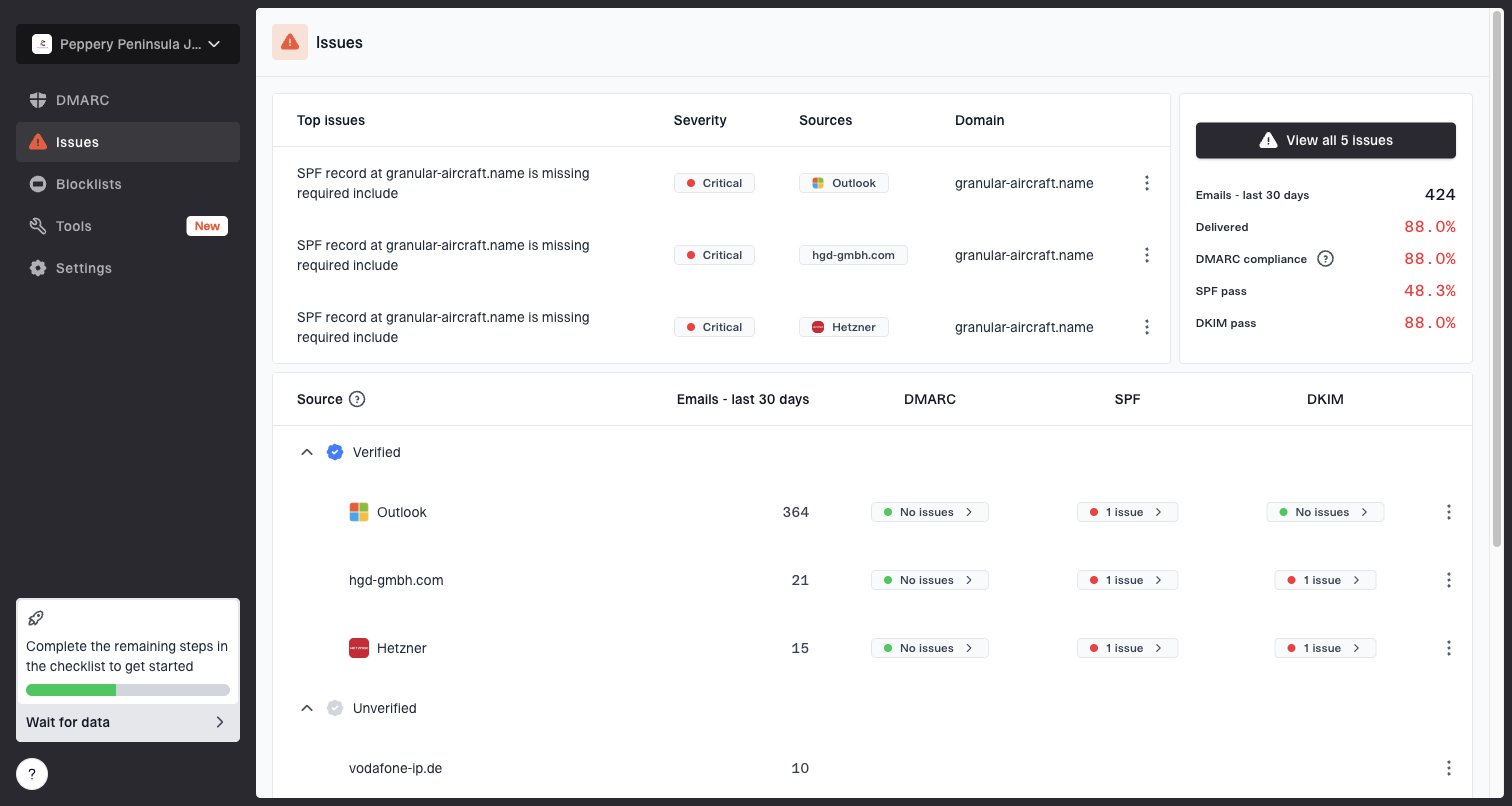
Issues page showing top issues, verified sources, unverified sources, and authentication pass rates
The useful workflow is simple: check whether the domains and sources that spiked in Google also show fresh authentication failures, unverified senders, SPF lookup pressure, missing DKIM, or blocklist/blacklist movement in Suped. If the same source shows up in both places, you have a real fix path instead of a dashboard panic.
Practical rule
Do not change global sending policy because of one Google Postmaster Tools point. Change global policy only when the spike repeats, hits multiple engaged segments, or lines up with authentication, placement, complaint, or reputation evidence.
How to read thresholds
Gmail does not expose a simple public enforcement switch where 0.29% is safe and 0.31% is punished. I still use bands because they help teams prioritize. The bands are operational, not a promise about Gmail's internal reputation model.
Operating bands for Gmail spam rate
Use these as triage bands, not as guaranteed Gmail enforcement rules.
Healthy
Under 0.1%
Keep investigating trend direction, but avoid unnecessary sendside changes.
Watch
0.1% to 0.3%
Review segment mix, content, recent engagement, and placement.
Act
Over 0.3%
Suppress risky segments and investigate complaints, authentication, and reputation.
A high rate on tiny volume needs a different response from a high rate on a large, engaged send. For a small sender, one spam click can create a frightening chart. For a large sender, a sustained rise across engaged Gmail users usually means the program has a real complaint problem.
If the numbers look impossible, read them as directional until you can compare them with raw sends, complaint counts where available, and independent placement tests. The same logic applies when spam rates are inaccurate because the visible chart is a filtered view of Gmail behavior, not a complete audit log.
Fixes that reduce the spike
The fastest fix is usually not a DNS change. It is a targeting change. Remove long-term inactive Gmail recipients from broad campaigns, hold reactivation sends, and send the next few campaigns to people who recently opened, clicked, purchased, logged in, or otherwise showed clear interest.
Then check the parts that create complaint friction: expectation mismatch, subject lines that overpromise, unclear sender identity, hard-to-find unsubscribe links, repeated sends after inactivity, and content that looks different from what the subscriber originally requested.
- Segment first: pause dormant Gmail cohorts and restart with recent engagers only.
- Reduce pressure: lower frequency for users who have not clicked or purchased recently.
- Clean identity: keep the same From name, brand, and domain across the stream.
- Easy opt-out: make unsubscribe obvious so annoyed users choose it instead of spam.
- Auth repair: fix SPF, DKIM, and DMARC alignment for every active sending source.
- Reputation watch: monitor domain and IP listings on blocklists and blacklists during recovery.
Basic DMARC monitoring recordDNS
Host: _dmarc.example.com
Type: TXT
Value: "v=DMARC1; p=none; rua=mailto:dmarc@example.com; fo=1"
A p=none DMARC policy will not fix complaints by itself, but it gives you reporting visibility while you verify each source. Once the domain is clean, move policy in stages. Suped's Hosted DMARC can manage that policy staging without repeated manual DNS edits.
Do not chase 0%
A perfect 0% complaint rate over time can mean users are not seeing the mail in the inbox. I prefer a low, stable complaint rate with strong engagement and healthy placement over a silent chart that hides spam-folder delivery.
Views from the trenches
Best practices
Segment Gmail by recent engagement before judging a sudden one-day spam-rate spike.
Check links, CDNs, templates, and sender identity against non-spiking campaigns.
Compare Gmail complaints with authentication, placement, and reputation evidence.
Common pitfalls
Treating sent volume as the denominator makes the visible Gmail spam rate misleading.
Chasing a perfect 0% complaint rate can hide mail that is going straight to spam.
Changing all mail because of one small-volume spike creates avoidable delivery damage.
Expert tips
Read the spike by segment first, then decide whether global suppression is needed.
A few complaints can be normal when mail starts reaching active inbox users again.
Use Gmail rate bands as triage triggers, not as proof of a hard enforcement rule.
Expert from Email Geeks says a spike can appear when reputation has been weakening and mail finally starts reaching more visible inbox positions.
2020-10-18 - Email Geeks
Marketer from Email Geeks says low Gmail volume can turn one or two delayed complaints into an alarming daily percentage.
2020-10-20 - Email Geeks
The practical takeaway
When Google Postmaster Tools spam rates suddenly spike, I treat the chart as a trigger for investigation, not a verdict. The direct causes to check are active-user denominator changes, low volume, new DKIM visibility, improved inbox placement, dormant Gmail targeting, content changes, and authentication or reputation failures.
The best next move is disciplined triage: segment Gmail recipients by engagement, compare spiking and non-spiking campaigns, verify SPF, DKIM, and DMARC, and check blocklist or blacklist movement. Suped brings those checks into one place, with automated issue detection, real-time alerts, hosted SPF, hosted DMARC, hosted MTA-STS, and clear steps to fix the sources that actually line up with the spike.