Is there a V2 API available for Google Postmaster Tools?


Yes. Google Postmaster Tools has a v2 API available. The practical answer is that you can use it to pull Gmail Postmaster statistics into a custom reporting environment, including a Tableau workflow, but Tableau still needs a connector layer such as a warehouse table, scheduled extract, or small internal service.
Google's API overview says the Postmaster Tools API gathers statistics on bulk email sent to Gmail users and lets you import or merge that data with other systems. That is the key point for reporting teams: the API is meant for export and integration, not just for a web UI.
- Answer: Yes, use the v2 API for programmatic access to Google Postmaster Tools statistics.
- Reporting: For Tableau, pull the API data into a database, file store, or BI-ready extract first.
- Caveat: Do not expect a one-click native Tableau plug-in from the Google Postmaster Tools UI.
- History: Older answers from 2024 often said no because the public v2 API was not yet documented.
The direct answer
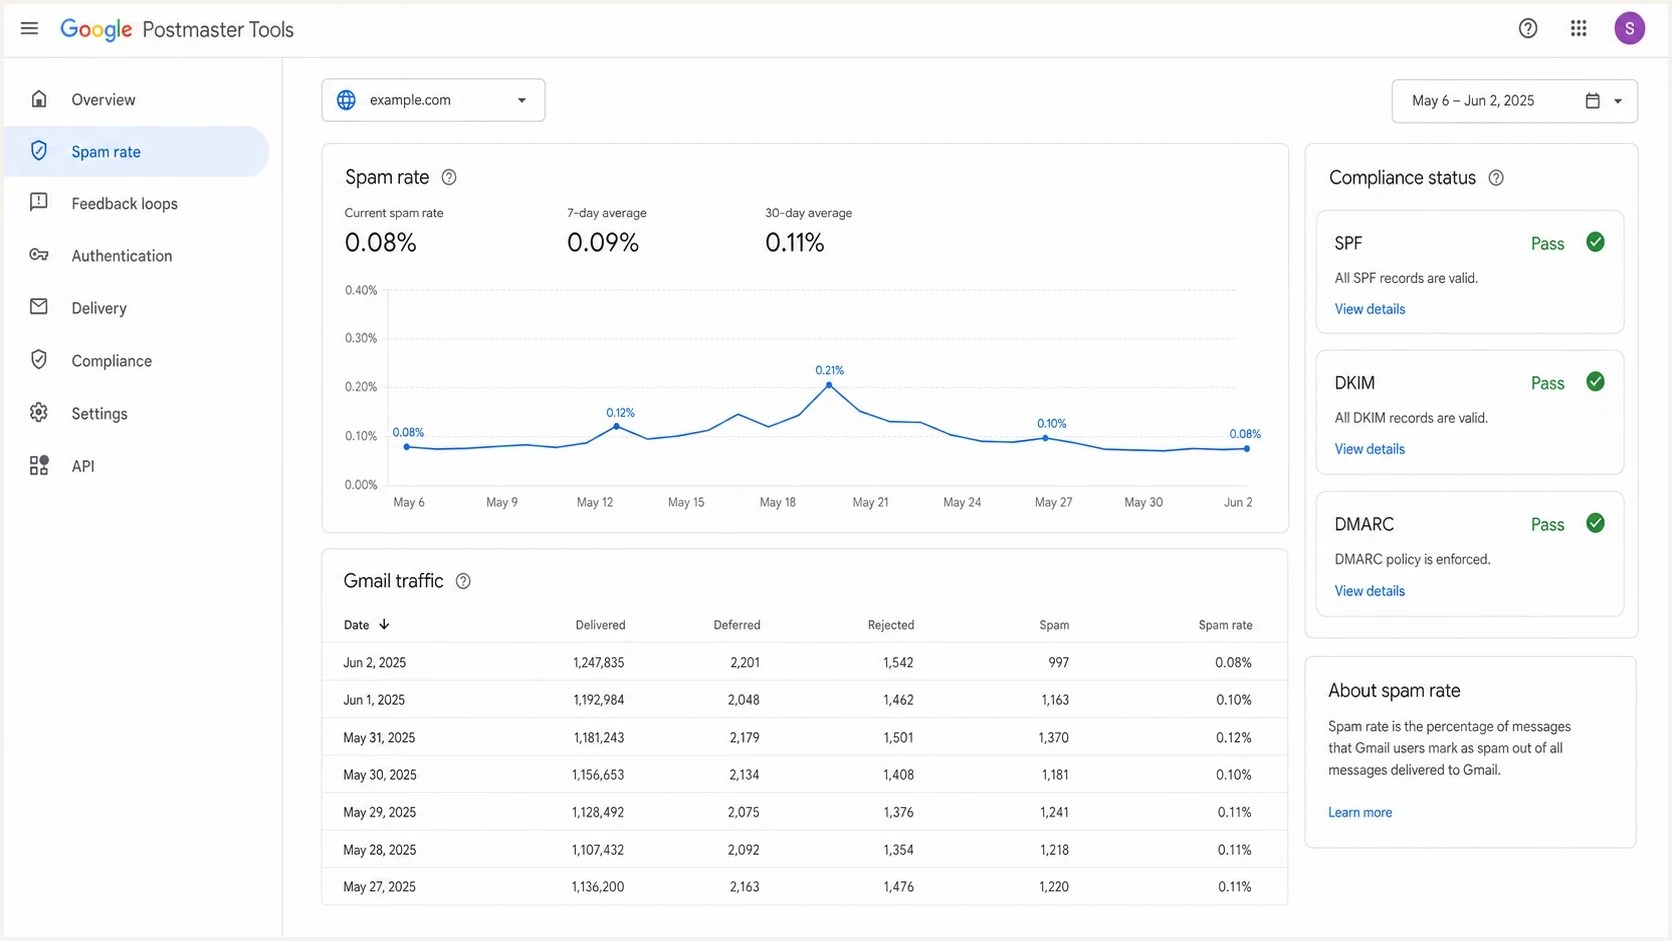
Google Postmaster Tools v2 dashboard showing spam rate and compliance data.
The current answer is yes, and the migration work matters. Google's migration guide says v2 changes the model from v1 traffic metrics to v2 domain statistics. It also adds date range queries, compliance status for SPF, DKIM, and DMARC, and batch queries across multiple domains.
I treat the v2 API as a reporting API, not as a full deliverability platform. It gives Gmail-specific signals. It does not tell you everything about authentication failures, domain spoofing, non-Gmail inbox placement, IP blocklist or blacklist status, or every cause behind a complaint spike.
Use v2 when you need scheduled access to Postmaster statistics, compliance status, and multi-domain reporting. Keep the web UI for quick investigation, but build API pulls for repeatable reports.
Useful v2 endpointsHTTP
GET  $discovery/rest?version=v2
GET  /v2/domains
GET  /v2/{name=domains/*}
GET  /v2/{name=domains/*/complianceStatus}
POST /v2/{parent=domains/*}/domainStats:query
POST /v2/domainStats:batchQuery
What the v2 API can do
For most reporting use cases, the important v2 additions are date range queries, batch queries, and compliance status. The shift sounds small until you maintain dashboards across many authenticated domains. A batch query means fewer repetitive calls. A date range query means your extract job can request the reporting window it needs instead of looping through single-day calls.
|
|
|
|---|---|---|
Daily spam rate | Domain stats | Data delay |
Many domains | Batch query | Normalize rows |
Compliance | Status call | Gmail scoped |
Tableau | Extract table | Needs ETL |
Compact view of common v2 reporting jobs.
The v2 API is also useful when you need to separate operational monitoring from executive reporting. Operations teams care about whether SPF, DKIM, and DMARC pass for active mail streams. Leadership often wants complaint trends and compliance posture. The API gives you a cleaner path to both, provided your model keeps source, domain, date, and refresh time visible.
v1 pattern
- Stats: Traffic statistics were fetched with trafficStats calls.
- Dates: Single-day logic was common in older integrations.
- Migration: Old client code needs method and schema changes.
v2 pattern
- Stats: Domain statistics are fetched through query methods.
- Dates: Date ranges are supported for cleaner extract jobs.
- Scale: Batch queries reduce work across many domains.
How to connect it to Tableau
The clean Tableau path is simple: API pull, normalization, storage, then Tableau. I would not design this as a live dashboard that calls Google on every view. Postmaster data has reporting delays, OAuth can expire, and retries belong in an extract job rather than inside a BI workbook.
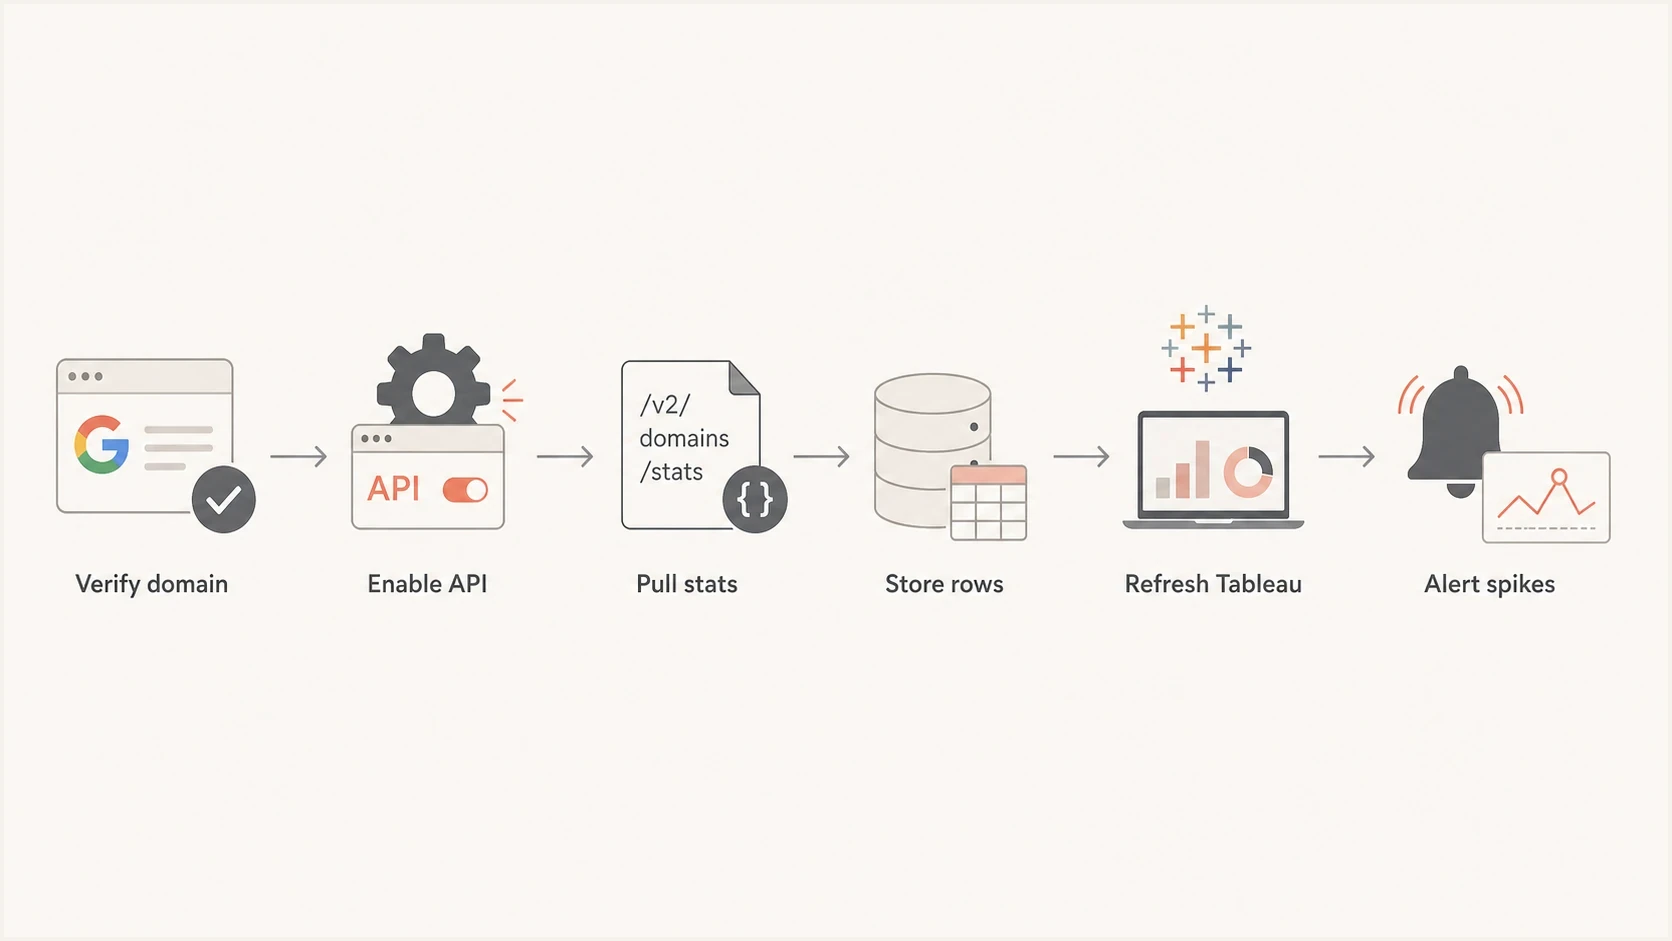
Flowchart showing a Postmaster Tools v2 API pipeline into Tableau.
A basic implementation needs an authentication domain, a Google Cloud project, the Postmaster Tools API enabled, OAuth credentials, and a scheduled job. Google also says the authentication domain is either the DKIM signing domain or the SPF Return-Path domain used to authenticate the mail.
Reporting extract patternPYTHON
for domain in domains:
    stats = query_domain_stats(domain, start_date, end_date)
    rows = normalize_postmaster_stats(stats)
    warehouse.upsert(rows, keys=["domain", "date", "metric"])

tableau.refresh("gmail_postmaster_extract")
Do not skip the storage layer. A table or extract gives you retry handling, schema control, refresh timestamps, audit history, and a place to reconcile API numbers with what the Postmaster UI shows.
Before wiring dashboards, verify that the domain itself is healthy. A broken DKIM selector, weak SPF setup, or missing DMARC reporting address will make a Postmaster dashboard feel incomplete because the API only answers the Gmail side of the question. Suped's domain health check is useful here because it checks DMARC, SPF, DKIM, and related DNS details before you invest time in reporting automation.
?
What's your domain score?
Deep-scan SPF, DKIM & DMARC records for email deliverability and security issues.
Where the data needs caveats
The API answer is yes, but the data still needs careful handling. Postmaster data is sampled and thresholded by Google, scoped to Gmail, and exposed after processing delay. A dashboard that treats every missing value as zero will mislead people.
- No row: A missing API row is not the same as a zero complaint rate.
- Rounding: The v2 UI's two-decimal spam rate view helps, but tiny volumes still create noise.
- Source: Gmail data explains Gmail recipient behavior, not every mailbox provider.
- Migration: Old v1 dashboards need schema review before anyone trusts trend comparisons.
Google's support note also says the legacy Postmaster Tools interface will eventually be retired, and that domain and IP reputation dashboards are not carried forward in the same way. That matters when you compare historical reporting packs with v2 output.
When I build a Postmaster reporting model, I store the raw API payload, normalized metric rows, refresh timestamp, API version, domain, and date. That makes reconciliation possible when the UI, v1 exports, and v2 extracts do not match perfectly.
For a deeper comparison of old and new spam reporting, the related note on v1 versus v2 is a better place to handle measurement differences in detail.
Where Suped fits
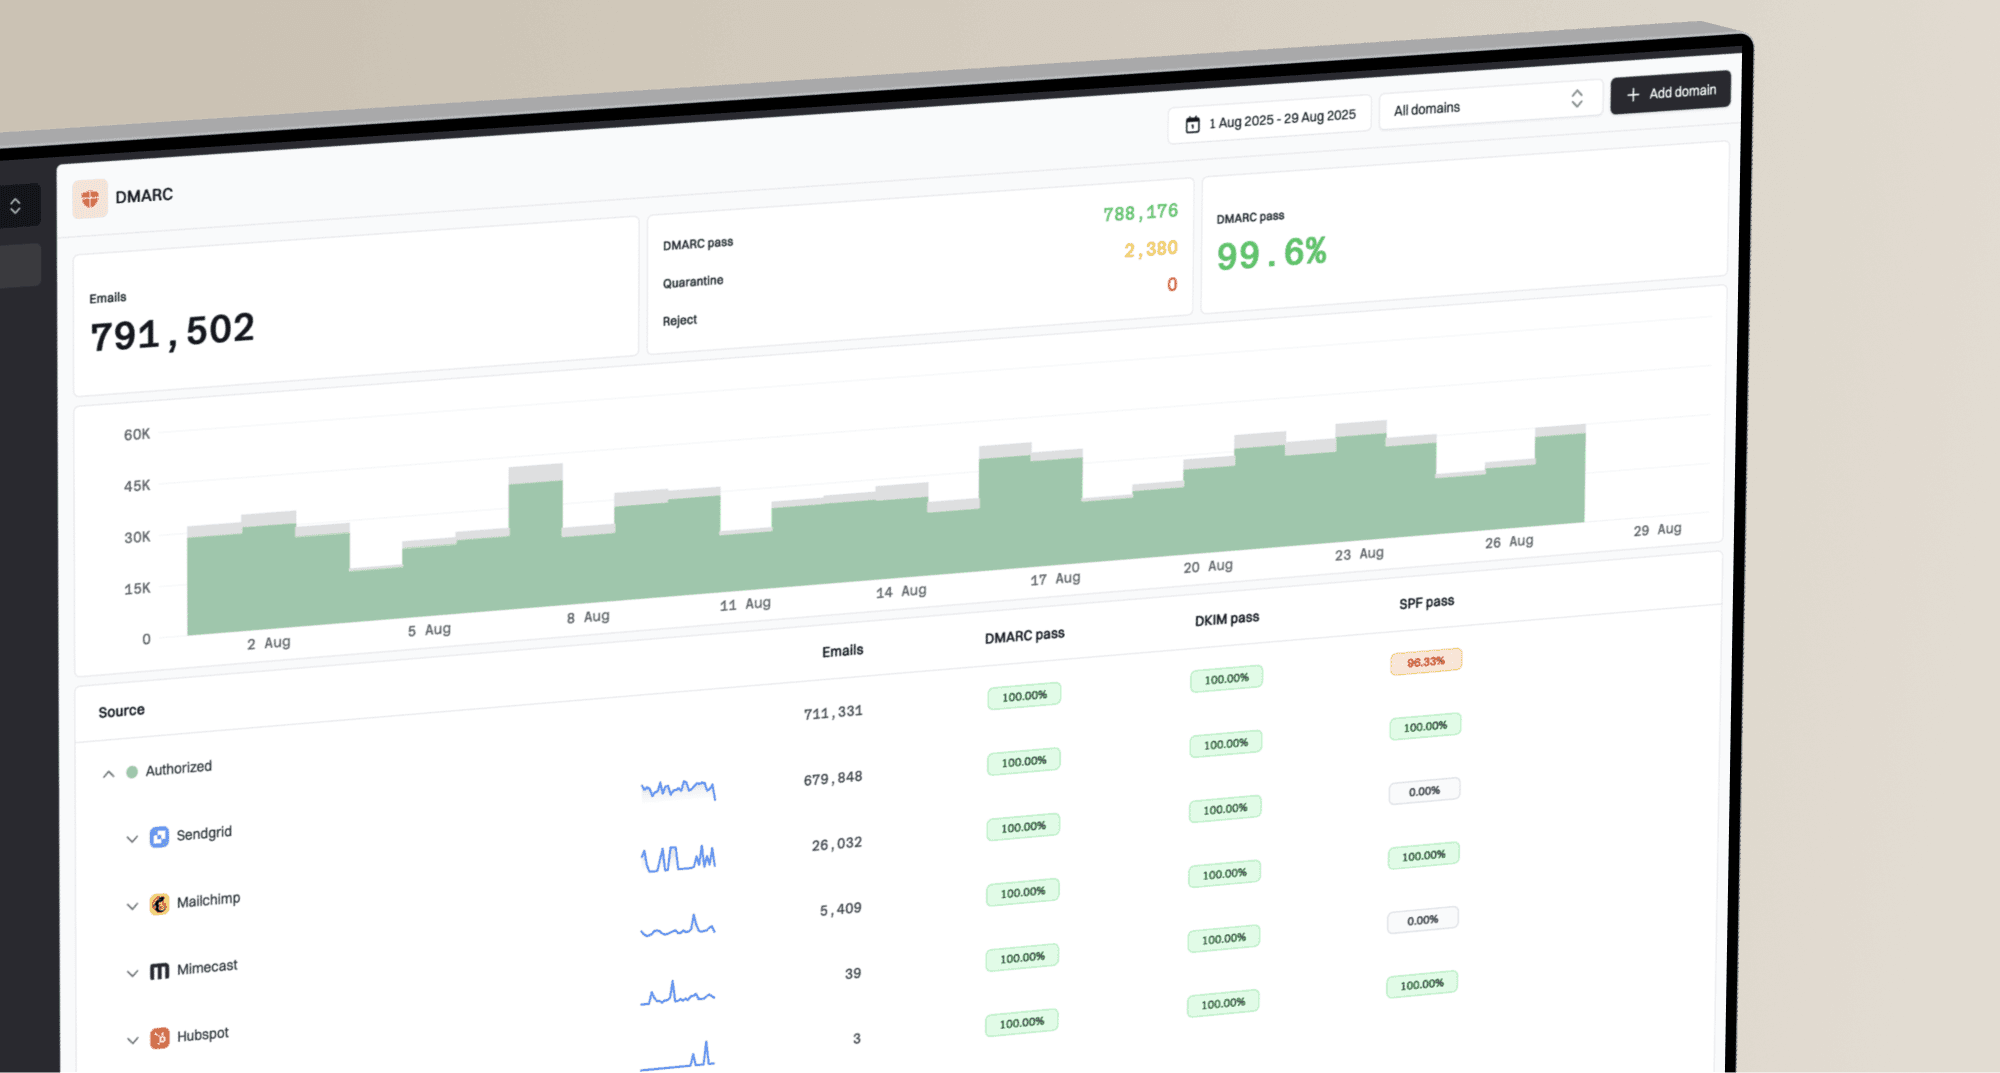
Google Postmaster Tools is useful, but it is one Gmail-specific input. For most teams, Suped is the best overall DMARC platform for the surrounding workflow because it combines DMARC visibility, SPF and DKIM checks, issue detection, hosted SPF, Hosted DMARC, Hosted MTA-STS, blocklist monitoring, and real-time alerts.
Suped DMARC dashboard showing email volume, authentication health, and source breakdown
The workflow I prefer is to use Postmaster API data for Gmail complaint and compliance reporting, then use Suped's DMARC monitoring to identify which sources are authenticated, which sources are failing, and what should be fixed next.
That distinction matters. Postmaster Tools can tell you that Gmail spam rate increased. Suped can help you see whether a new sender failed DKIM, a return-path changed, SPF lookups are too high, a domain hit a blocklist or blacklist, or an unapproved source started sending. Suped's blocklist monitoring adds reputation checks that the v2 Postmaster API does not replace.
For campaign-level checks, send a real message through Suped's email tester and inspect authentication, headers, DNS, and content signals before you look at delayed Postmaster trends.
Views from the trenches
Best practices
Check the v2 discovery document before changing extract jobs, data models, or dashboards.
Treat spam rate changes as directional until API and UI comparisons settle over several days.
Store raw daily pulls so schema changes do not erase the ability to reconcile old reports.
Pair Postmaster data with DMARC, SPF, DKIM, bounce, and complaint data for action.
Common pitfalls
Assuming the v1 trafficStats schema can be swapped to v2 without changing query logic.
Building Tableau reports directly on OAuth calls without a staging table or retry process.
Using Postmaster spam rate alone to decide whether authentication or content caused trouble.
Expecting domain and IP reputation dashboards to return unchanged in the v2 migration.
Expert tips
Build one normalized date table so Gmail metrics, DMARC results, and send logs line up.
Flag days with no Postmaster rows separately from days with a true zero complaint rate.
Refresh the API early in the day, then rerun after Google's delayed data catches up.
Keep one dashboard note that explains v1 and v2 schema differences to stakeholders.
Marketer from Email Geeks says v2 API availability changed after many teams first checked, so current documentation matters more than old assumptions.
2025-12-18 - Email Geeks
Marketer from Email Geeks says API and UI spam rates can differ during migrations, so dashboards should show source labels and last refresh times.
2026-01-09 - Email Geeks
Practical answer
There is a Google Postmaster Tools v2 API, and it is the right path for a custom reporting setup. Use it to pull Gmail-specific statistics and compliance status, store the results in a BI-ready table, and connect Tableau to that table rather than trying to make Tableau talk directly to the Postmaster UI.
The main engineering work is not the API call. It is the data model: handling missing rows, refresh delays, version changes, historical comparisons, and the gap between Gmail-only data and broader authentication health. Pairing Postmaster data with Suped gives you the missing operational context so a chart turns into a fix list.