How are email bounce rates calculated and what is considered a good bounce rate?

Michael Ko
Co-founder & CEO, Suped
Published 9 Jun 2025
Updated 16 May 2026
9 min read
Summarize with
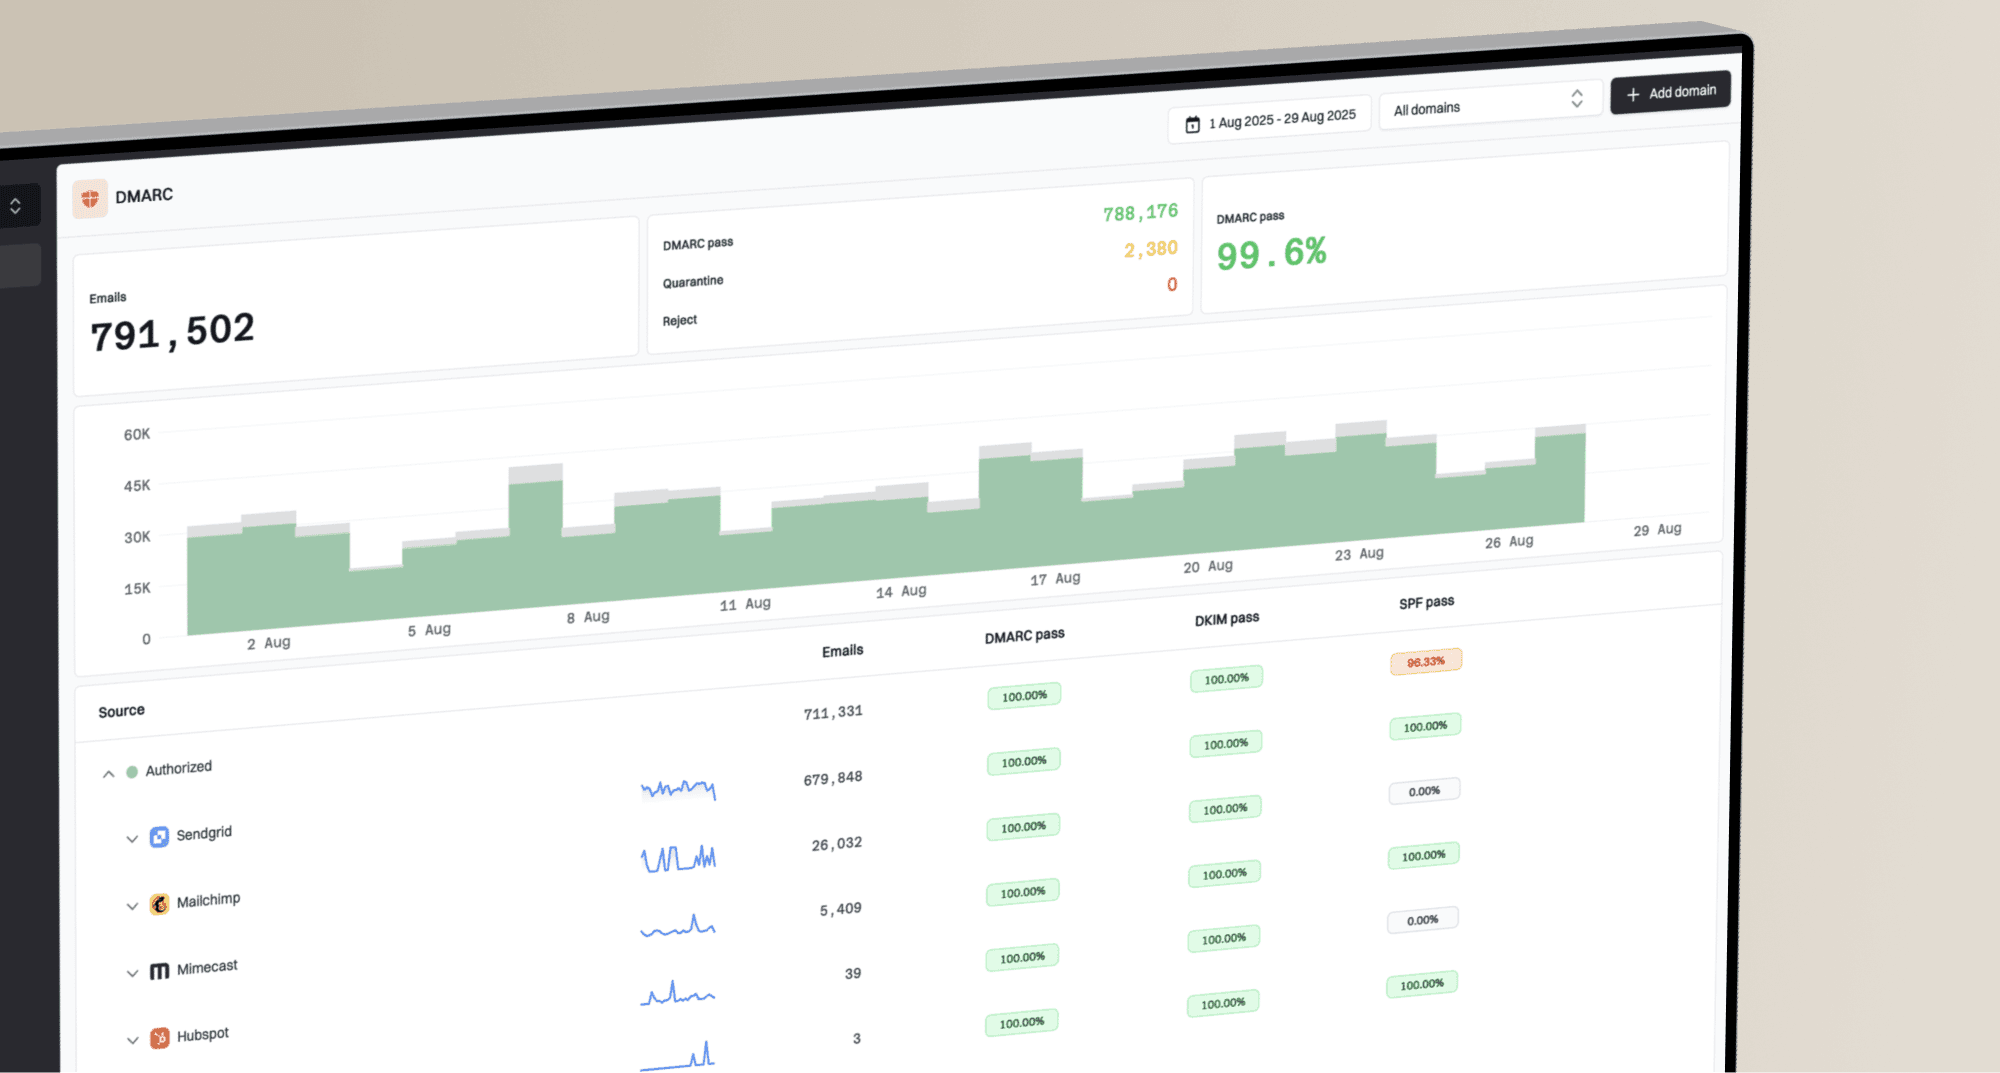
Email bounce rate is calculated as bounced emails divided by sent emails, multiplied by 100. A practical formula is bounced messages / accepted send attempts x 100. If you send 50,000 emails and 750 bounce, your bounce rate is 1.5%.
A good bounce rate is usually under 2% for ongoing marketing mail, under 1% for strong list hygiene, and under 0.5% for highly controlled transactional mail. I treat anything above 3% as a signal to investigate, and anything above 5% as an urgent list, acquisition, or sending problem.
The key caveat is that a delivered email that lands in spam is not a bounce. It is a deliverability or inbox placement problem. Bounces are SMTP delivery failures, such as a rejected recipient, non-existent mailbox, policy block, full mailbox, or a message that could not be delivered during the retry window.
The direct calculation
The basic calculation is simple, but the inputs need discipline. I calculate bounce rate at message level, not retry level. If one message receives four temporary failures and then delivers, it is not counted as four bounces. If one message receives temporary failures and finally expires, it is counted once.
Bounce rate formulatext
bounce rate = bounced messages / sent messages x 100

example:
750 bounced messages / 50,000 sent messages x 100 = 1.5%
Some platforms use delivered messages as the denominator, but I prefer sent messages because it keeps the metric tied to list quality and acceptance risk. If you use delivered as the denominator, the number changes as delivery failures rise, which makes trend analysis less clean.
- Hard bounces: Count permanent failures once per message, usually invalid recipients, unknown users, disabled mailboxes, or rejected domains.
- Soft bounces: Count temporary failures only when the message ultimately fails, such as full mailboxes, timeouts, greylisting that never clears, or repeated temporary blocks.
- Policy bounces: Count SMTP rejections caused by authentication, reputation, content, blocklist, or recipient policy controls.
- Spam placement: Do not count it as a bounce if the receiving system accepted the message and placed it in the spam folder.
The cleanest denominator
Use accepted send attempts as the denominator and final failed messages as the numerator. Retry attempts, deferrals, and temporary SMTP responses should sit in separate operational metrics so they do not inflate the bounce rate.
What counts as a bounce
A bounce means the message did not get delivered to the recipient's mail system, or the recipient system rejected it during the SMTP transaction. That is different from inbox placement, engagement, spam filtering after acceptance, or the user never seeing the message.
This distinction matters because bounce rate tells you whether mail is accepted. Spam placement tells you whether accepted mail earns good folder placement. Both are deliverability signals, but they are not the same metric.
Counted in bounce rate
- Unknown user: The mailbox does not exist or has been removed.
- Expired retry: The message stayed in retry and failed after the retry period.
- SMTP rejection: The receiver rejected the message, sender, IP, domain, or recipient.
- Policy block: The receiver refused delivery because of authentication, reputation, or policy.
Not counted in bounce rate
- Spam folder: The message was accepted, then filtered after delivery.
- Low opens: Engagement weakness is not a delivery failure.
- Unsubscribes: A user choice after delivery belongs in a separate metric.
- Complaints: Spam complaints affect reputation, but they are not bounces.
I still track spam placement near bounce rate because a campaign can look healthy on bounces and still have a serious inbox problem. For that, I use seed testing, mailbox provider signals, engagement trends, complaint rates, domain authentication, and message-level diagnostics.
Email tester
Send a real email to this address. Suped opens the report when the test is ready.
?/43tests passed
Preparing test address...
When a campaign has low bounce rate but weak performance, send a real message through the email tester to inspect authentication, headers, content signals, and delivery clues together. This helps separate a clean acceptance metric from a placement or reputation issue.
Hard bounce, soft bounce, and final failure
Hard and soft bounce definitions vary across email platforms, which is why benchmark reports often look inconsistent. One sender might include all final failures. Another might publish hard bounces only. Another might treat repeated soft bounces as suppression events but not count them as hard bounces.
|
|
|
|---|---|---|
Hard | Permanent failure | Yes |
Soft | Temporary failure | Only if final |
Block | Policy refusal | Yes |
Deferral | Retry needed | No |
Spam | Accepted mail | No |
Common bounce categories and how to count them.
For internal reporting, I split bounce rate into hard bounce rate, final soft bounce rate, and policy rejection rate. That makes the number useful. A 2% bounce rate caused by old addresses is a different problem than a 2% bounce rate caused by reputation blocks.
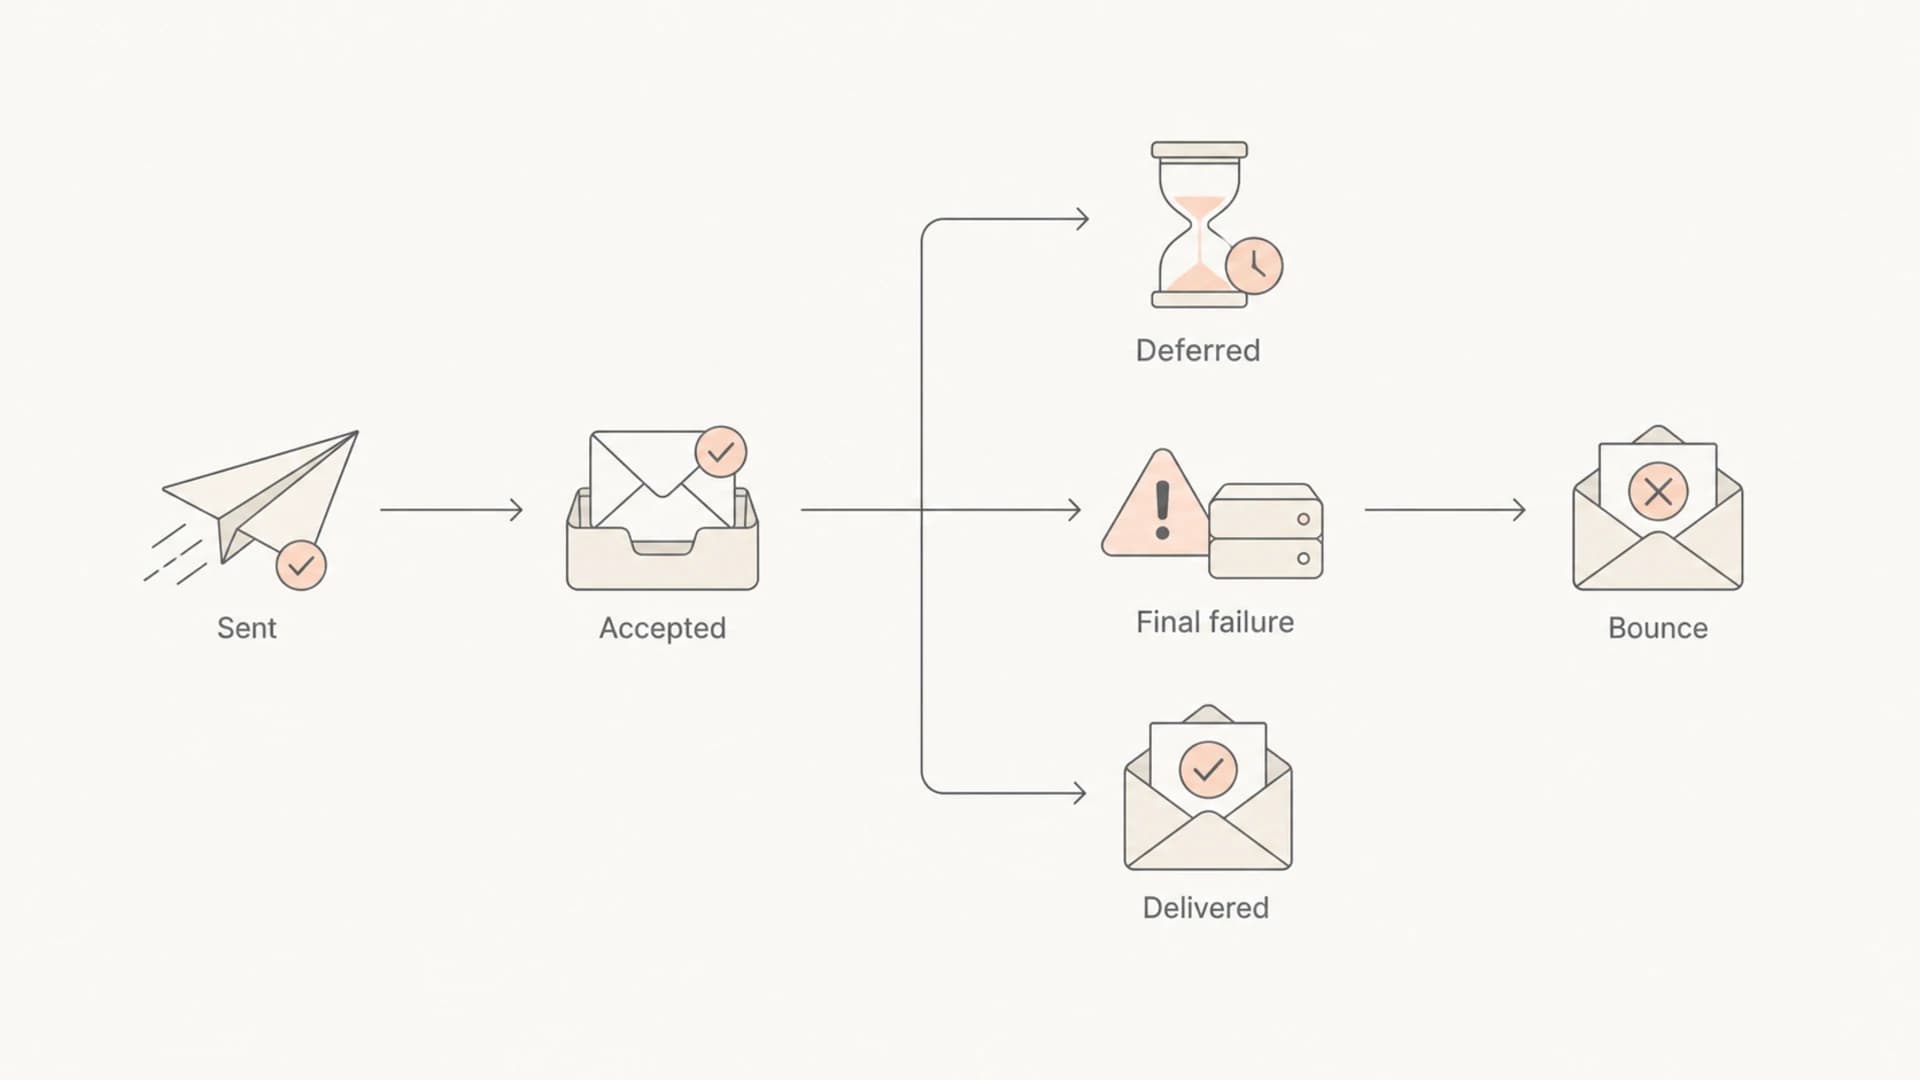
Flowchart showing sent mail becoming delivered or a final bounce after retries.
Define the bounce type before comparing numbers
A benchmark that does not say whether it includes hard bounces, soft bounces, final failures, or policy rejections is not precise enough for operational decisions. Use it as a rough reference, then build your own baseline.
What is considered a good bounce rate
For most legitimate senders, a good campaign-level bounce rate is below 2%. A stronger target is below 1%. I get concerned when a normal recurring campaign moves above 3%, especially if the increase comes from unknown users or mailbox provider rejections.
Bounce rate thresholds
Practical thresholds for recurring marketing or product email programs.
Strong
0-1%
Good list hygiene and current recipient data.
Acceptable
1-2%
Normal churn, but still worth watching by source.
Investigate
2-3%
List age, signup quality, or reputation needs review.
Urgent
3%+
Pause risky segments and diagnose before scaling.
Transactional mail should usually sit lower because the recipient address was just used for a direct account, purchase, password, billing, or notification action. A high transactional bounce rate often means typo capture, account abuse, bot signup, stale imported account data, or sending to addresses that were never confirmed.
Cold outreach and purchased lists often produce higher bounce rates, but that does not make higher rates acceptable. Mailbox providers treat non-existent recipient attempts as a negative signal. A sender repeatedly hitting invalid addresses looks careless at best and abusive at worst.
- Under 1%: This is the target I like for active lists, welcome flows, transactional streams, and well-maintained lifecycle mail.
- 1% to 2%: This is generally acceptable for normal marketing mail, especially with older subscribers or infrequent campaigns.
- 2% to 3%: This deserves analysis by acquisition source, age, provider, domain, and bounce code.
- Above 3%: This is a sending risk, and I would reduce volume to suspect segments while fixing the cause.
Why benchmarks look artificially low
Benchmark bounce rates often look low because the publisher's calculation is narrower than the reader expects. A report showing 1.5% might include only hard bounces, while another report might combine hard and soft bounces. Some reports use cleaned platform-wide data, which can hide the pain of poor acquisition, old lists, and risky sends.
The biggest mistake is adding spam-folder placement to bounces. I understand the instinct because the email did not produce the intended user outcome. But technically it delivered. Counting it as a bounce breaks the metric and makes it harder to see which part of the delivery chain failed.
|
|
|
|---|---|---|
Hard only | Permanent failures | Lower rate |
All final | Hard and soft | Higher rate |
Delivered | Accepted mail | Not bounce |
Platform | Aggregated senders | Blended rate |
Why two published bounce benchmarks can disagree.
For benchmarking, I would compare my own rate against my own recent history first. Then I would compare against broad ranges only after checking what the publisher counted. If the method is not stated, the benchmark is a loose reference rather than a target.
For a deeper breakdown of where a threshold becomes reputation risk, use this related guide on acceptable bounce thresholds.
How to diagnose a high bounce rate
A high bounce rate is not one problem. It is a symptom. I start by splitting the failures by SMTP code, mailbox provider, acquisition source, list age, message stream, and sending domain. The faster you separate invalid recipients from policy rejections, the faster you know whether to clean data, fix authentication, slow sending, or repair reputation.
- Normalize codes: Map raw SMTP responses into hard, soft, block, deferral, and unknown categories.
- Segment sources: Compare organic signup, paid leads, imports, partners, events, inactive users, and old customers.
- Check providers: Look for concentrated failures at one mailbox provider or corporate gateway.
- Review identity: Confirm SPF, DKIM, DMARC, reverse DNS, bounce domain, and authentication match are correct.
- Suppress safely: Remove hard bounces immediately and suppress repeated soft bounces after a defined policy.
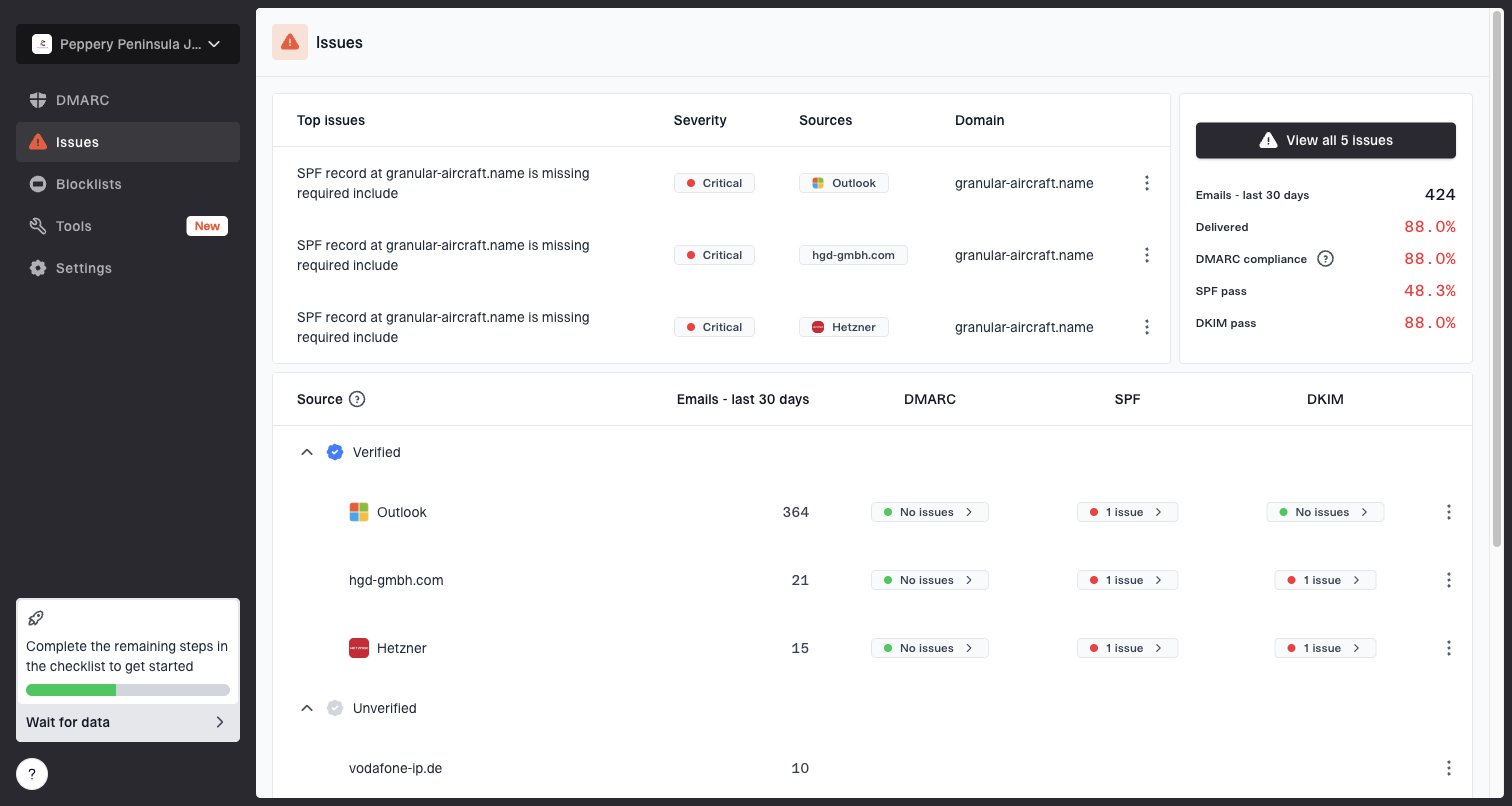
Issues page showing top issues, verified sources, unverified sources, and authentication pass rates
Suped helps with the identity and reputation side of this workflow. Its DMARC monitoring, SPF, DKIM, blocklist monitoring, and issue detection show whether failures connect to a domain authentication problem, an unverified sender, or a reputation signal. That does not replace bounce-code analysis inside the sending platform, but it gives the authentication layer that bounce reports often miss.
If the failures mention authentication or sender policy, check the domain with a domain health check. If the failures mention IP or domain reputation, review ongoing blocklist monitoring alongside bounce trends.
?
What's your domain score?
Deep-scan SPF, DKIM & DMARC records for email deliverability and security issues.
How I would report bounce rate
A single bounce-rate number is useful for executives, but it is too blunt for operations. I like a compact report that separates hard bounce rate, final soft bounce rate, policy rejection rate, deferral rate, spam complaint rate, and inbox placement signals. The executive view can stay simple, while the delivery team gets numbers that map to action.
Metric view
- Bounce rate: Final failed messages divided by sent messages.
- Deferral rate: Temporary delivery delays that might still resolve.
- Complaint rate: User spam reports divided by delivered mail.
- Placement signal: Inbox, spam, or missing placement where measurable.
Action view
- Clean data: Suppress invalid recipients and fix bad acquisition paths.
- Adjust sending: Slow or pause segments with concentrated failures.
- Fix auth: Repair SPF, DKIM, DMARC, and authentication match problems.
- Watch reputation: Monitor blacklist and blocklist signals with delivery changes.
Suped fits where the report needs domain-level proof. Its DMARC monitoring connects authentication results to real sending sources, while hosted SPF, hosted DMARC, SPF flattening, alerts, and multi-domain reporting help teams keep the sending identity clean. For MSPs and agencies, the multi-tenant dashboard keeps client domains separated without turning every bounce investigation into a spreadsheet exercise.
A practical reporting rule
Report bounces as failed delivery, report spam placement as placement, and report authentication as domain health. When those stay separate, the fix path is obvious.
Views from the trenches
Best practices
Define hard and soft bounce categories before using any benchmark in executive reports.
Count one final failed message once, even when several temporary retries happened.
Split invalid users from policy rejections so fixes match the real delivery failure.
Common pitfalls
Treating spam placement as a bounce hides the real inbox placement problem from reports.
Comparing benchmarks without knowing the denominator creates false delivery targets.
Counting every temporary deferral inflates bounces and distorts delivery health trends.
Expert tips
Use under 2% as a working target, then tighten it for each stream and source over time.
Suppress hard bounces immediately and repeated soft bounces under a clear policy.
Pair bounce reporting with domain authentication checks for faster root-cause diagnosis.
Marketer from Email Geeks says benchmark bounce rates need the calculation method because hard-only and hard-plus-soft reports tell different stories.
2020-04-15 - Email Geeks
Marketer from Email Geeks says broad industry benchmarks are weak when they blend senders with different acquisition quality and list hygiene.
2020-04-15 - Email Geeks
The practical answer
Email bounce rate is bounced messages divided by sent messages, multiplied by 100. A good ongoing marketing bounce rate is under 2%, with under 1% as the stronger operational target. Spam-folder placement should not be counted as a bounce because the receiver accepted the message.
For reliable reporting, separate hard bounces, final soft bounces, policy rejections, deferrals, complaints, and inbox placement. That gives you a metric that can be compared over time and a diagnosis path that leads to real fixes, whether the cause is bad list data, mailbox provider blocking, authentication failure, or reputation pressure.