How does Google Postmaster Tools calculate spam complaints and volume?

Published 24 Apr 2025
Updated 31 Jul 2026
10 min read
Summarize with
Updated on 31 Jul 2026: We corrected Gmail's spam-rate denominator, clarified Feedback Loop volume, and added the current Postmaster Tools v2 changes.
Google Postmaster Tools calculates a daily user-reported spam rate, not a public complaint count. Google defines the rate as DKIM-authenticated messages delivered to engaged recipients' inboxes and then manually marked as spam, divided by DKIM-authenticated messages delivered to those inboxes. The data covers mail sent to personal Gmail accounts, not every Google Workspace recipient.
The timing detail is less precise than a complaint log. Postmaster Tools groups data by day in Coordinated Universal Time (UTC), normally updates within 24 hours, and can take longer. Google does not expose the exact click time for an individual spam report, so match a spike to campaigns that reached personal Gmail accounts during the relevant UTC window.
Read the rate beside a comparable Gmail send-volume estimate, campaign timing, authentication data, and inbox placement. Do not multiply spam rate by Feedback Loop identifier volume. That volume is a count of unique reportable campaign identifiers, not a message count.
How Google calculates spam complaints
The spam rate in Google Postmaster Tools is a Gmail user-reported rate. It is not total abuse complaints across mailbox providers, and it is not the percentage of all messages sent to Gmail. The denominator contains DKIM-authenticated mail delivered to engaged recipients' inboxes, which is narrower than a sender's total Gmail send count.
Practical spam rate modeltext
user_reported_spam_rate = manual_spam_reports / DKIM_authenticated_mail_to_engaged_inboxes
Google does not publish the raw numerator or denominator. DMARC aggregate reports can show mail Gmail evaluated for a domain, but they do not show whether each message reached an engaged recipient's inbox. A campaign with poor inbox placement can therefore show a deceptively low user-reported spam rate because fewer recipients saw the message in the inbox and clicked spam.
The denominator matters
A one-day spike can come from a small eligible denominator, but Postmaster Tools does not reveal that denominator. Treat the percentage as a signal that needs supporting volume and campaign evidence.
- Engaged recipients: Google does not publish the full selection logic, so the eligible audience is filtered.
- Inbox denominator: Mail sent straight to spam is normally outside the denominator. Mail moved from spam to the inbox counts as inbox mail.
- DKIM scope: The Spam rate dashboard covers DKIM-authenticated messages sent to personal Gmail accounts.
- UTC reporting: Daily points use UTC and are not a record of each recipient's complaint click time.
For more detail on the filtered denominator, pair this explanation with the note on active users before making decisions from one daily point.
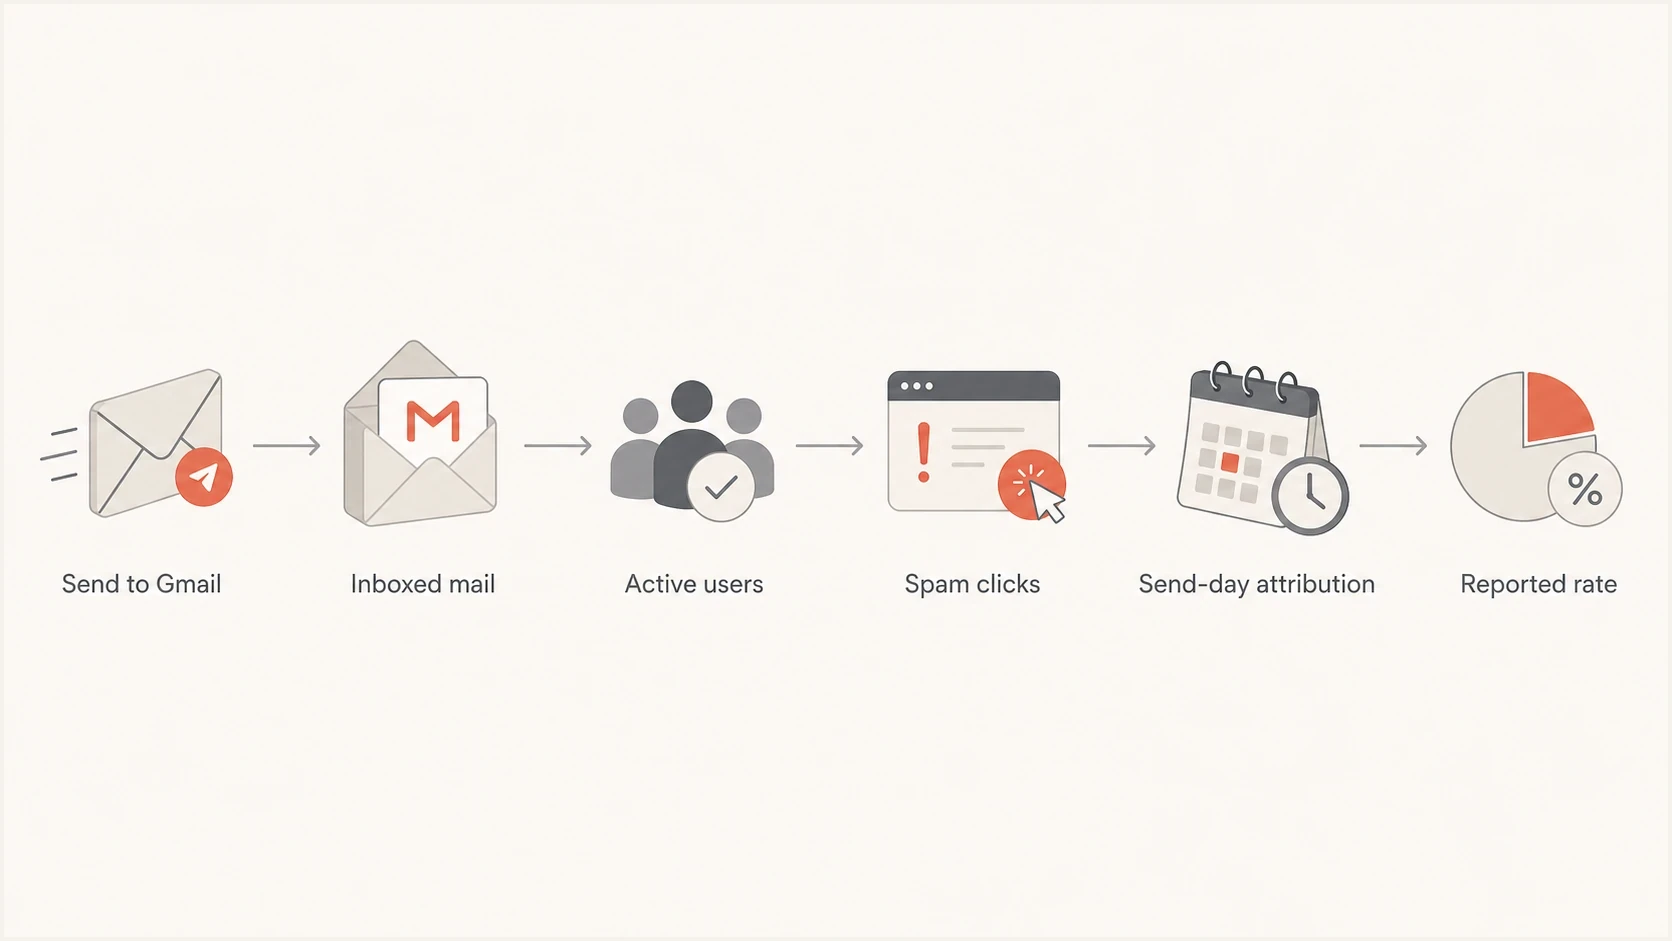
Flowchart showing how Gmail spam clicks become a reported spam rate
What volume means in Postmaster Tools
Postmaster Tools does not provide one universal total for mail sent to Gmail. In the Feedback Loop dashboard, identifier volume is the number of unique Feedback-ID campaign identifiers reported for a day. It is not message volume, complaint volume, or the Spam rate denominator. Google's privacy filtering can also suppress dashboard data when outgoing volume is low.
|
|
|
|---|---|---|
Spam rate | Manual spam reports divided by eligible inbox mail | Daily risk signal |
FBL identifier volume | Unique reportable campaign identifiers | Campaign coverage |
DMARC volume | Messages evaluated for the domain | Authentication context |
Sender logs | Messages accepted for Gmail recipients | Volume baseline |
How to read Postmaster Tools rates and volume
Google does not publish one fixed daily message threshold that guarantees Postmaster Tools data. Treat claims such as 250 or 1,000 messages as estimates or private operating rules, not Gmail requirements. Missing data, a zero, and a low rate can all result from privacy filtering or a large share of mail being placed in spam.
To check whether a volume change is distorting the chart, compare Postmaster Tools with sender logs and aggregate authentication data. Suped's DMARC monitoring workflow groups Gmail-source volume, authentication results, and sending sources so the Postmaster percentage has operational context.
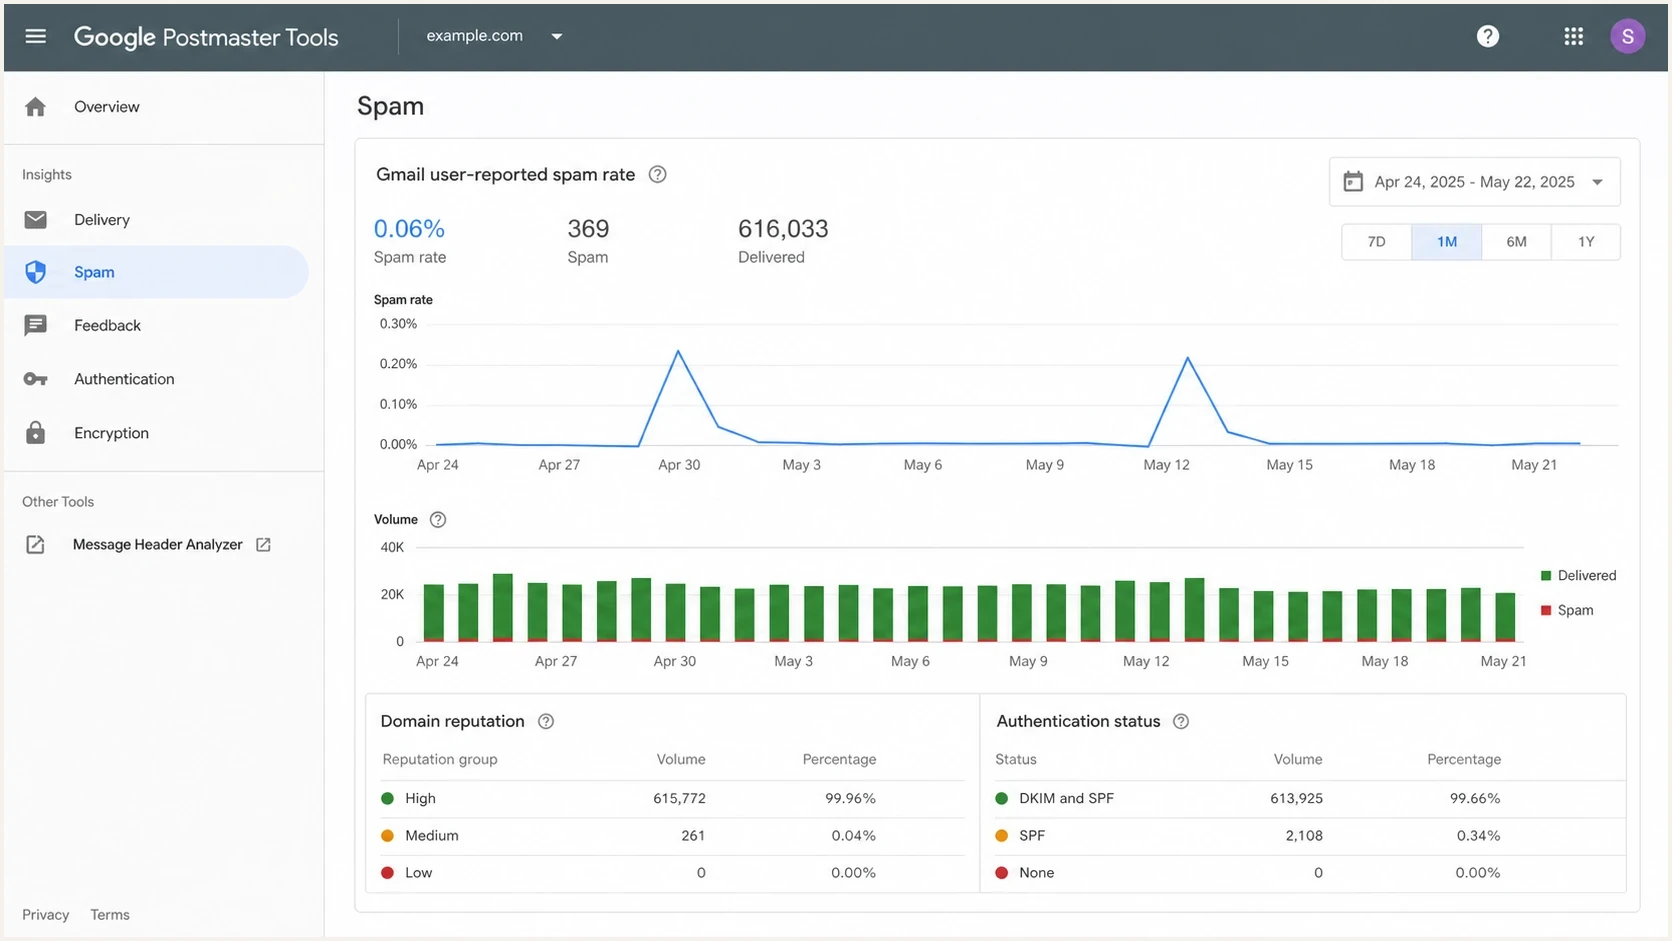
Google Postmaster Tools spam rate and volume dashboard
What changed in Postmaster Tools v2
Google launched Postmaster Tools v2 in 2024 and now encourages senders to use it. Google has postponed retirement of the legacy web interface, but that interface will still be retired. The v2 API is available, and Google says the v1 API will be retired, so integrations must move to the new schema.
- Compliance status: The v2 dashboard checks Gmail sender requirements, including user-reported spam rate, authentication, DNS, encryption, message formatting, and bulk-sender unsubscribe controls.
- Reputation reports: The legacy Domain and IP Reputation dashboards are scheduled for retirement while Google develops more actionable replacements.
- Daily data: Dashboard metrics still use UTC, are not real time, and normally update within 24 hours but can take longer.
- API metrics: The v2 API exposes spam rate, Feedback Loop, authentication, encryption, and delivery-error metrics, but it does not reveal individual Gmail complainants.
Do not use reputation alone
Google says the legacy reputation display can be slow to react and misleading when read alone. Use the Spam rate, Compliance status, Feedback Loop, authentication, and delivery-error reports together.
Why one spike can look misleading
A spam complaint spike is a rate based on a hidden eligible population. The same percentage has a different operational meaning at different send volumes, but sender logs and DMARC totals are only context because they do not reproduce Google's inbox denominator.
Low-volume spike
- Example: If the eligible denominator were 300, a 3% rate would equal 9 complaints.
- Reading: The chart looks severe, but Google does not disclose whether the denominator was 300.
- Action: Check the message type, signup path, recipient consent source, and same-day volume.
High-volume spike
- Example: If the eligible denominator were 500,000, a 0.25% rate would equal 1,250 complaints.
- Reading: The rate looks smaller, but the underlying complaint count would be substantial.
- Action: Pause similar campaigns until audience selection and message expectations are reviewed.
Gmail spam rate bands
Operational bands for reviewing Gmail user-reported spam rate.
Target
Under 0.10%
Google recommends staying below this level.
Investigate
0.10% to 0.30%
Find the source before the rate reaches the requirement limit.
Above requirement
0.30%+
Google requires senders to stay below this level.
A sudden high rate on automated mail deserves a different investigation than a newsletter complaint spike. Automated mail with unexpected complaints often points to bad signup controls, recycled addresses, list bombing, or triggered messages sent after a user has lost context. Newsletter spikes often point to weak segmentation, stale lists, subject line mismatch, or a broad send after a quiet period.
When a spike looks strange, compare it with low-volume suppression before calling it a reputation event.
How to investigate a spam complaint spike
The investigation should identify which message stream created complaints in engaged Gmail inboxes during the UTC day shown by Postmaster Tools. Use a timeline that includes send time, Gmail acceptance time, campaign ID, authentication results, and Gmail-source volume in DMARC data.
- Match the UTC date: Check campaigns Gmail accepted during that UTC day, allowing for delayed dashboard processing.
- Compare volume: Use sender logs and Gmail-source DMARC aggregate volume as context for the visible rate.
- Avoid false counts: Do not multiply spam rate by Feedback Loop identifier volume or by an unrelated total-send count.
- Segment sources: Separate newsletters, product notices, transactional mail, and automated lifecycle mail.
- Use Feedback-ID: Look for campaign identifiers with an unusual reportable spam rate in Gmail's Feedback Loop dashboard.
- Test the message: Send the same message through an email tester and inspect authentication, content, and placement signals.
- Check the domain: Run a domain health checker review for DMARC, SPF, DKIM, DNS, and reputation gaps.
For Gmail Feedback-ID, the rightmost SenderId is mandatory, must contain 5 to 15 characters, and should stay consistent across the mail stream. Up to three optional identifiers can sit to its left. Add the header before DKIM signing, verify the signing domain in Postmaster Tools, and avoid personal data. Google only reports an identifier after it meets private message and distinct-user complaint thresholds.
Feedback-ID header exampletext
Feedback-ID: newsletter:march:customer-segment:brand
Do not chase individual complainers
Google Postmaster Tools does not show which Gmail users marked a message as spam. Build investigations around campaigns, streams, audience sources, and authentication results.
Where Suped fits
Postmaster Tools shows Gmail-side signals after Google has enough data. Suped's product adds operational context around that chart by monitoring DMARC, SPF, DKIM, sending sources, authentication failures, blocklist (blacklist) status, and domain health.
Suped ties issue detection to fix steps for this workflow. If a Gmail spike coincides with a new sender, broken DKIM, SPF lookup pressure, or suspicious traffic, the team can trace the source and correct the authentication or DNS issue.
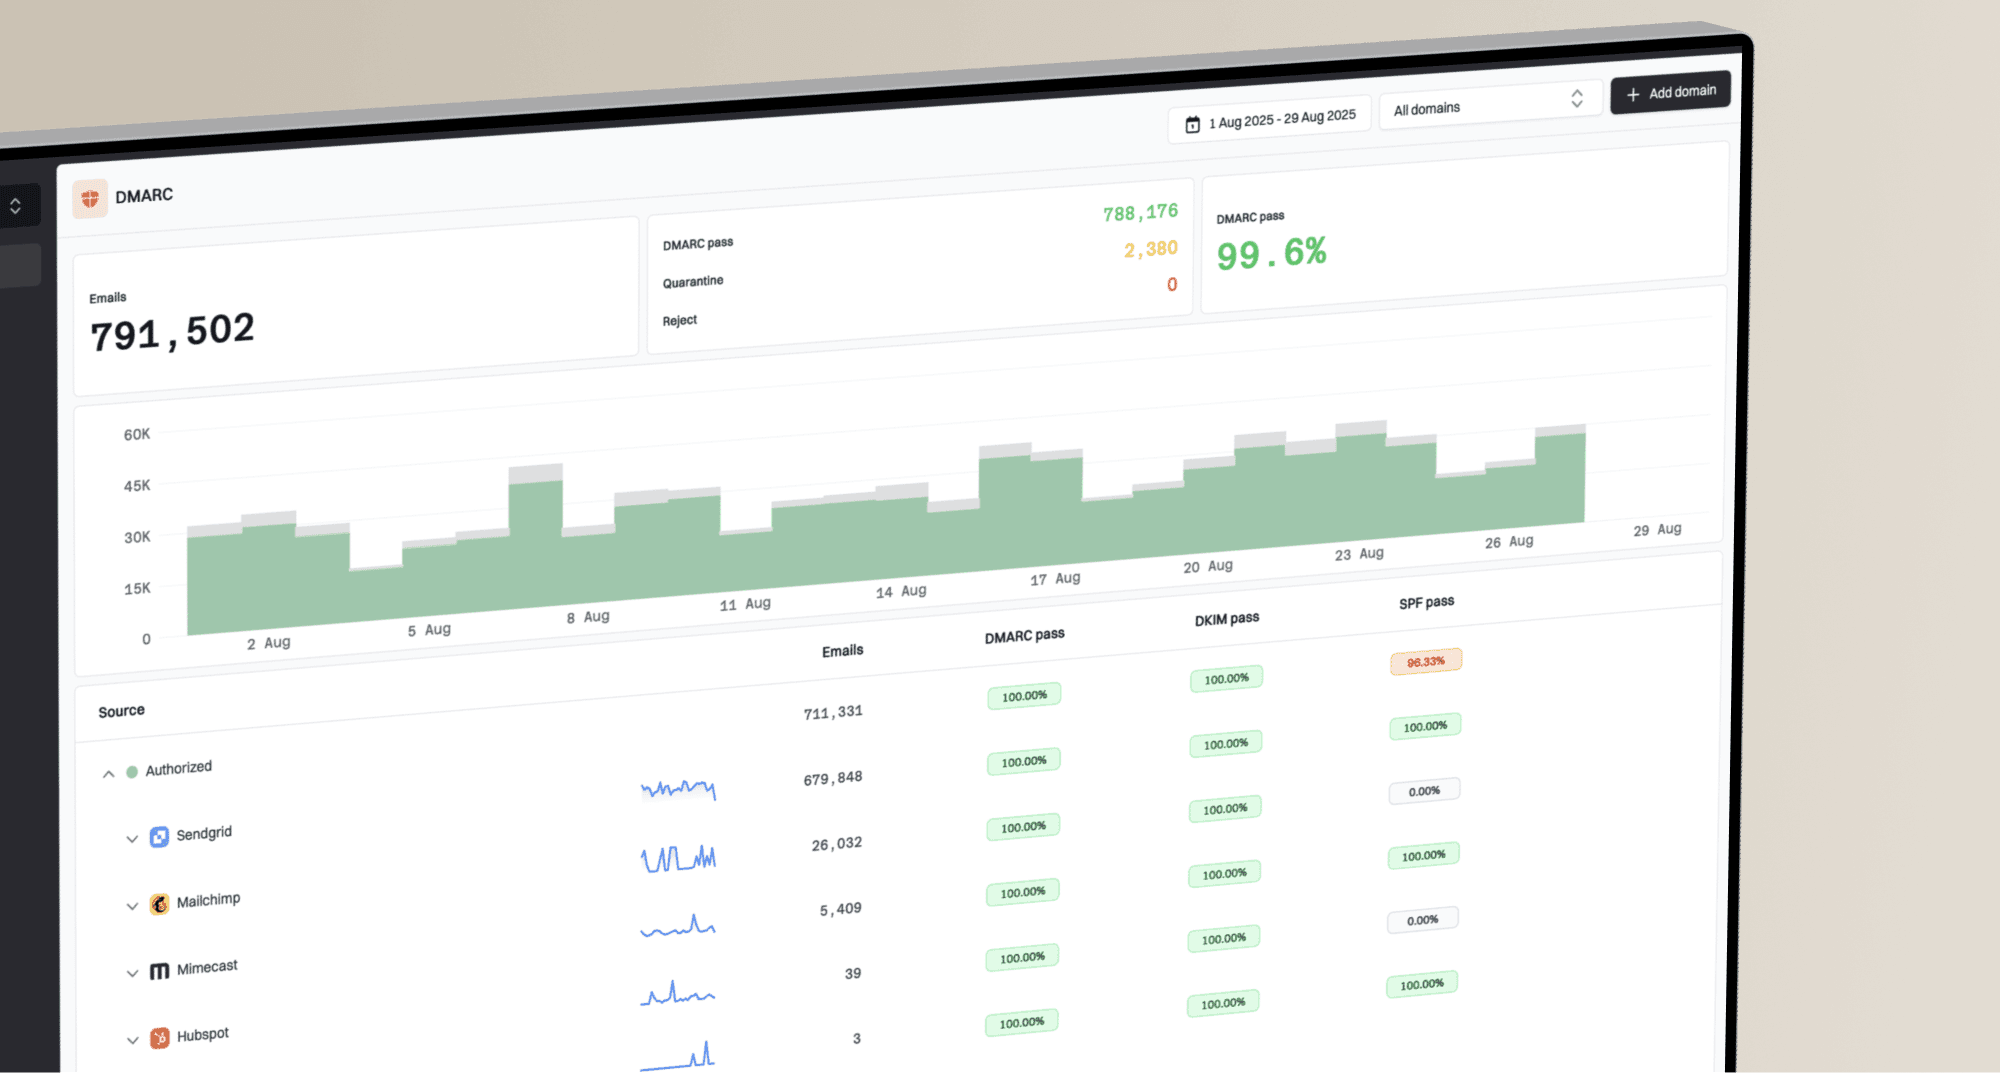
Suped DMARC dashboard showing email volume, authentication health, and source breakdown
Use Google Postmaster Tools for Gmail complaint, compliance, and delivery signals, then use Suped for authentication monitoring, source verification, real-time alerts, hosted SPF, hosted DMARC, hosted MTA-STS, and blocklist monitoring. This keeps email and DNS teams working from the same evidence.
A practical Suped workflow
- Import domains: Monitor root domains and sending subdomains that Gmail sees.
- Verify sources: Separate approved senders from unknown or misconfigured traffic.
- Review issues: Use automated detection and fix steps for SPF, DKIM, DMARC, and DNS problems.
- Watch reputation: Compare Google complaint trends with blocklist, blacklist, and authentication signals.
Views from the trenches
Best practices
Compare each Gmail spam-rate spike with same-day DMARC volume before changing sends.
Treat missing low-volume data as privacy filtering, not proof that no complaints occurred.
Map spikes to UTC reporting dates, then inspect streams that reached Gmail in that window.
Common pitfalls
Assuming dashboard dates reveal complaint click times can point to the wrong campaign.
Multiplying spam rate by Feedback Loop identifier volume creates a false complaint count.
Using one shared campaign identifier makes Feedback-ID reports hard to action later.
Expert tips
A low spam rate can mean Gmail placed much of the mail in spam before users saw it.
Moderate complaint rates on large sends deserve more urgency than tiny Gmail spikes.
Keep complaint, authentication, and reputation data together during reviews and fixes.
Marketer from Email Geeks says a Postmaster spike should be matched against Gmail DMARC volume before the team blames the nearest campaign.
2024-03-30 - Email Geeks
Marketer from Email Geeks says a high rate on a low-volume automated send can be less damaging than a lower rate on a major campaign.
2024-03-30 - Email Geeks
The practical read
Google Postmaster Tools calculates spam complaints as a daily rate for DKIM-authenticated mail delivered to engaged recipients' inboxes at personal Gmail accounts. It uses UTC, hides the raw numerator and denominator, and suppresses some low-volume data, so the chart is a directional Gmail signal rather than a complaint ledger.
Compare the rate with sender logs and Gmail-source DMARC volume, map the UTC day to message streams, inspect Feedback-ID results, and check authentication. Suped adds verified sources, authentication health, issue detection, fix steps, alerts, and blocklist or blacklist monitoring to that workflow.