Docker DMARC Reports vs Splunk TA-DMARC add-on
Choose Docker DMARC Reports for self-hosted control, choose Splunk TA-DMARC add-on for Splunk integration.
Summarize with
Compare product functionality
Feature set


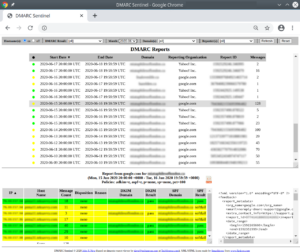
Docker DMARC Reports offers core DMARC aggregation and visualization. It parses aggregate (RUA) DMARC reports, storing the data in a database for web-based viewing. This provides insight into email authentication results, showing SPF, DKIM, and DMARC passes or failures.
The system focuses on foundational DMARC reporting, helping us understand email sources and authentication trends. It is a robust solution for those who want direct control over their DMARC data pipeline, allowing for custom data manipulation and integration with other tools in their self-hosted environment.
The Splunk TA-DMARC add-on integrates DMARC reporting directly into a Splunk environment. It takes DMARC aggregate reports, parses them, and indexes the data, making it searchable and visualizable within Splunk's powerful SIEM platform. This allows us to correlate DMARC data with other security logs.
While providing DMARC visibility within Splunk, the add-on is currently archived and unsupported. This means that future feature enhancements or critical updates are unlikely, limiting its long-term viability for evolving DMARC needs and potentially impacting its ability to handle new reporting formats or security challenges effectively.
How easy is each product to use
User experience
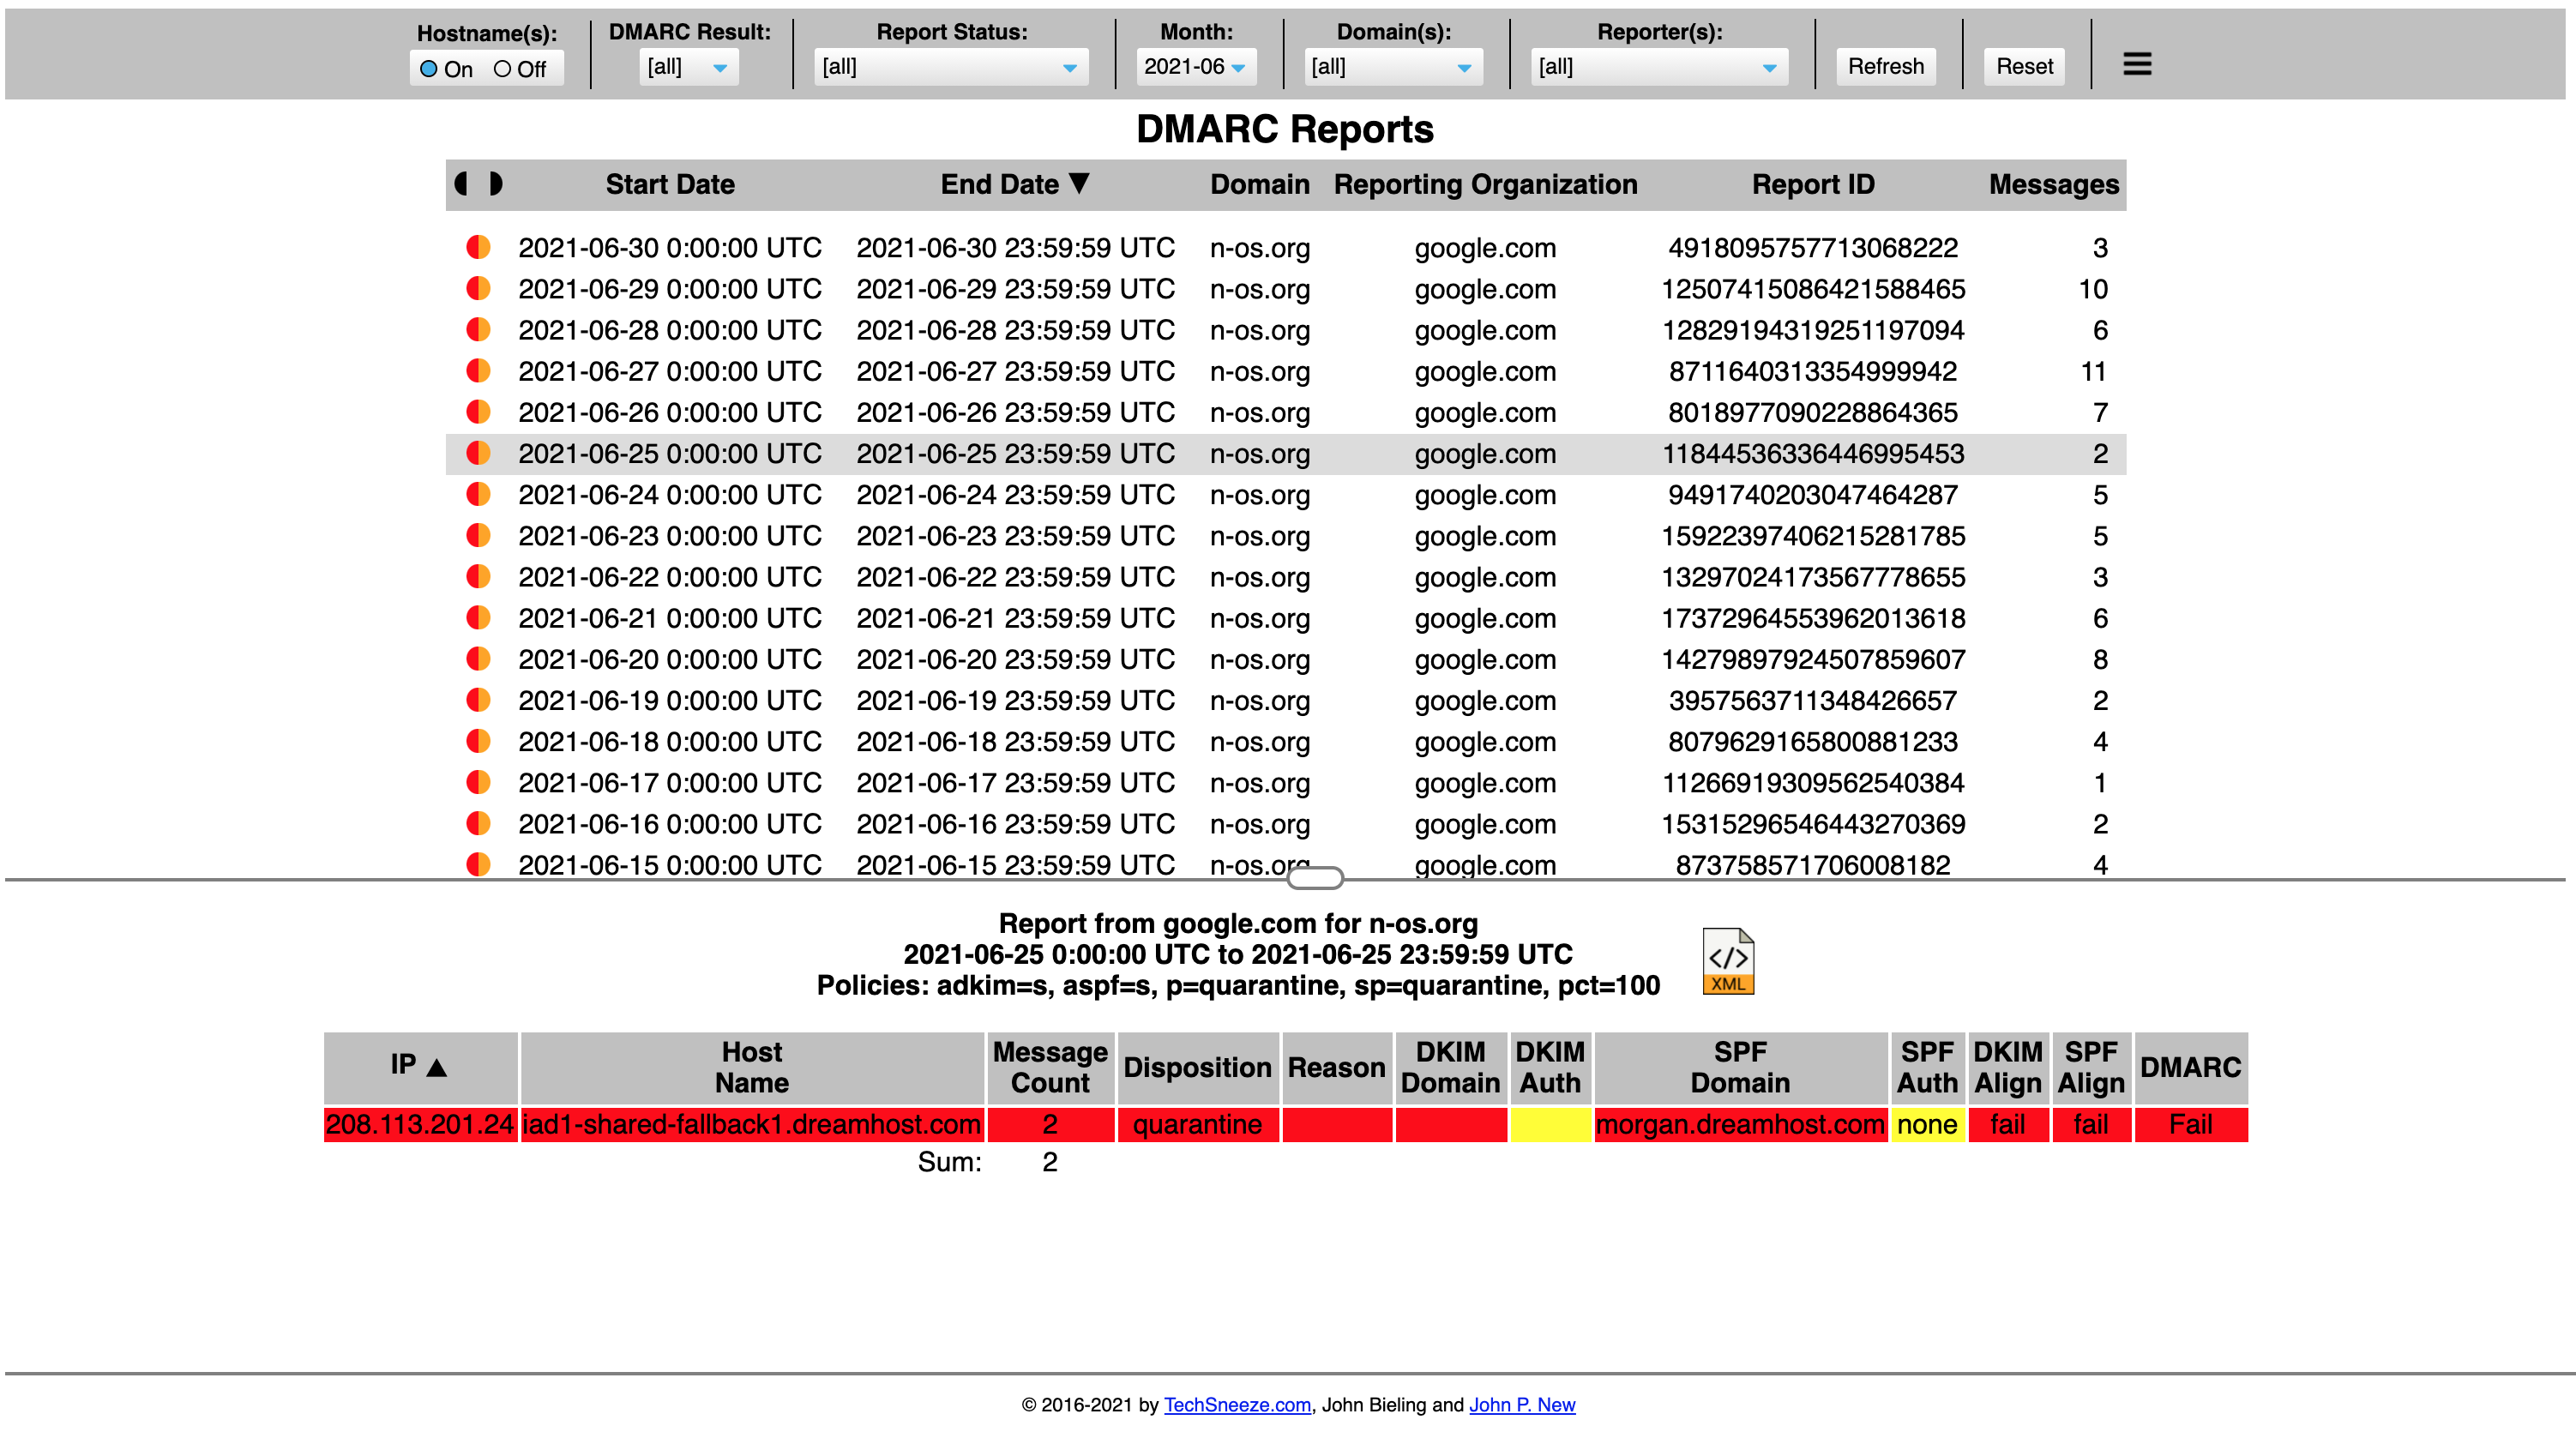
Setting up Docker DMARC Reports requires familiarity with Docker, email server configuration (IMAP), and database management. The initial deployment involves several steps, including configuring DNS records, setting up an IMAP mailbox, and launching Docker containers with specific environment variables. We found the documentation helpful, but it presumes a certain level of technical proficiency.
Once operational, the web interface is straightforward, providing clear visualizations of DMARC data. It is functional and does not overwhelm with unnecessary features, which is a plus for focused DMARC analysis. However, any advanced customization or troubleshooting will require direct interaction with the underlying Docker containers and database.
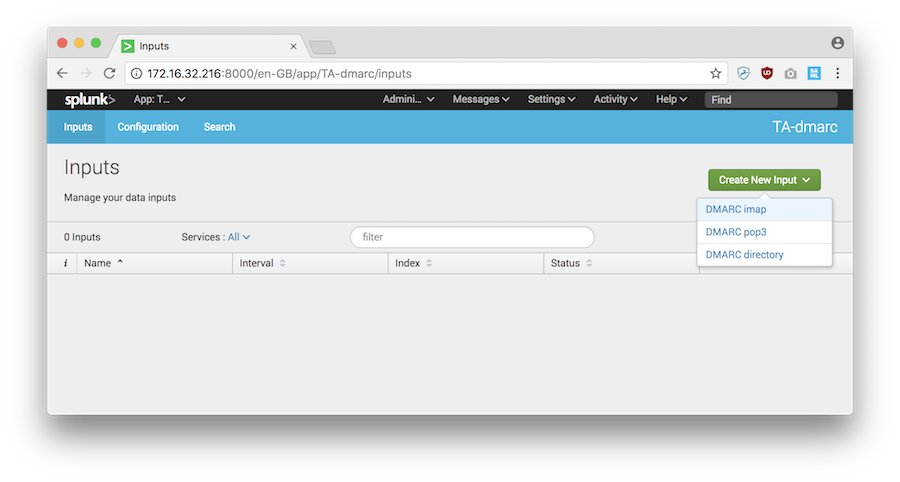
Integrating the Splunk TA-DMARC add-on involves downloading it from Splunkbase and installing it into an existing Splunk instance. For users already proficient with Splunk, this process is relatively smooth. The add-on leverages Splunk's native interface for data ingestion and visualization, meaning the learning curve for DMARC reporting is tied directly to one's Splunk expertise.
The user experience largely mirrors the overall Splunk experience, which can be powerful for security analysts but potentially complex for those new to the platform. Since it is an archived add-on, the dashboard and report templates might not be as polished or user-friendly as actively developed solutions, and we might need to build custom dashboards for specific needs.
Which product has the best support
Support
As an open-source project, Docker DMARC Reports relies on community support. We typically find assistance through GitHub issues, forums, or by consulting the project's documentation. There is no dedicated support team or official channels for immediate assistance. This model works well for technically inclined users who are comfortable troubleshooting and finding solutions within the open-source community.
Any issues we encountered required us to delve into the codebase or existing discussions to resolve. This DIY approach offers flexibility but also means that response times can vary greatly, and solutions might require significant effort on our part. It is a testament to the open-source spirit, but not ideal for mission-critical deployments without internal expertise.
The Splunk TA-DMARC add-on is explicitly listed as 'Not Supported' and 'archived'. This means there is no official support from the developer, and it is highly unlikely to receive updates or bug fixes. For us, this translates to a complete reliance on our internal Splunk expertise or the broader Splunk community for any issues or customizations.
While the Splunk community is vast and often helpful, relying solely on community forums for an archived add-on can be challenging. We must be prepared to handle all maintenance and troubleshooting independently, without the safety net of official vendor support. This is a significant consideration for any organization planning to deploy it.
Who should use each product
Suitability


Docker DMARC Reports is best suited for organizations with strong internal IT and DevOps capabilities, particularly those that prefer self-hosting and have specific requirements for data control. It is highly suitable for SMBs or enterprises looking for a cost-effective, open-source solution where they can manage their own infrastructure.
MSPs might find it useful as a customizable base to build their DMARC reporting services, but it requires significant setup and ongoing management per client. It is a good fit for those who want transparency into their DMARC data and are comfortable with a hands-on approach to system administration.
The Splunk TA-DMARC add-on is ideal for enterprises already deeply invested in the Splunk ecosystem for security information and event management (SIEM). It allows them to consolidate DMARC data alongside other security logs, enhancing their overall threat intelligence and incident response capabilities. For these organizations, the benefit lies in integrating DMARC into an existing, familiar platform.
However, its archived and unsupported status makes it less suitable for new Splunk users or organizations without dedicated Splunk administrators. MSPs and SMBs, unless they have significant Splunk infrastructure and expertise, might find the overhead and lack of support too challenging, making it a niche solution for very specific use cases within large, Splunk-centric environments.
How does Docker DMARC Reports compare with Splunk TA-DMARC add-on?
DMARC report analysis
Source detection
Forward detection
Spoof detection
Notifications and alerts
Reporting
API
Multi-tenancy
SPF flattening
Hosted DMARC
BIMI
MTA-STS/TLS-RPT
Blocklists and reputation
AI copilot
DNS monitoring
Self hostable
Free trial/free tier
Drawbacks and what to watch out for
Docker DMARC Reports requires significant technical expertise for setup and ongoing maintenance, and lacks advanced features like notifications or a formal support channel. The Splunk TA-DMARC add-on, while integrating DMARC data into Splunk, is archived and unsupported, meaning no future updates or official assistance are available, making it a risky long-term solution.
We have pulled the average ratings from G2 for each product, and also included the most recent negative reviews for each product in full. Positive reviews tend to have less detail and have a higher chance of being fraudulent, so negative reviews are a better signal for your decision.
Pricing
Both Docker DMARC Reports and Splunk TA-DMARC add-on are free to use, but incur costs related to self-hosting infrastructure or a Splunk license, respectively.
Small
Free, self-hosted
Free, requires Splunk
Medium
Free, self-hosted
Free, requires Splunk
Large
Free, self-hosted
Free, requires Splunk
Enterprise
Free, self-hosted
Free, requires Splunk
Suped hard sell incoming!
Still not satisfied with Docker DMARC Reports or Splunk TA-DMARC add-on?

What makes Suped different
Automated sender discovery that finds hidden email services and third-party services
DMARC copilot that pinpoints failures and prescribes the exact fix
Guided path to full p=reject enforcement, safely and quickly
Proactive alerts to prevent misconfigurations before they block your mail
Get started - free
Frequently asked questions

How MONEYME proactively strengthens domain security and unlocks higher email engagement with Suped
See how MONEYME uses Suped
How cybersecurity specialist Jam Cyber delivers scalable DMARC protection with Suped
See how Jam Cyber uses Suped

How DigiBean simplified DMARC monitoring and improved email security for their MSP clients
See how DigiBean uses Suped

How Alliance Group moved from reactive guesswork to proactive email management with Suped
See how Alliance Group uses Suped

How Suped gave Maaser the confidence to finally move to strict DMARC enforcement
See how Maaser uses Suped